This indicator monitors the investment in, and adoption of, new or improved technologies in forest management and in forest-based industries. It also quantifies the level of research and development. Significant investment in research, development and new technologies result in continual improvements to forest management practices.
This is the Key information for Indicator 6.2b, published October 2024.
- Investment in research and development activities R&D can lead to improvement in forest management practices, and to new technologies for commercial adoption.
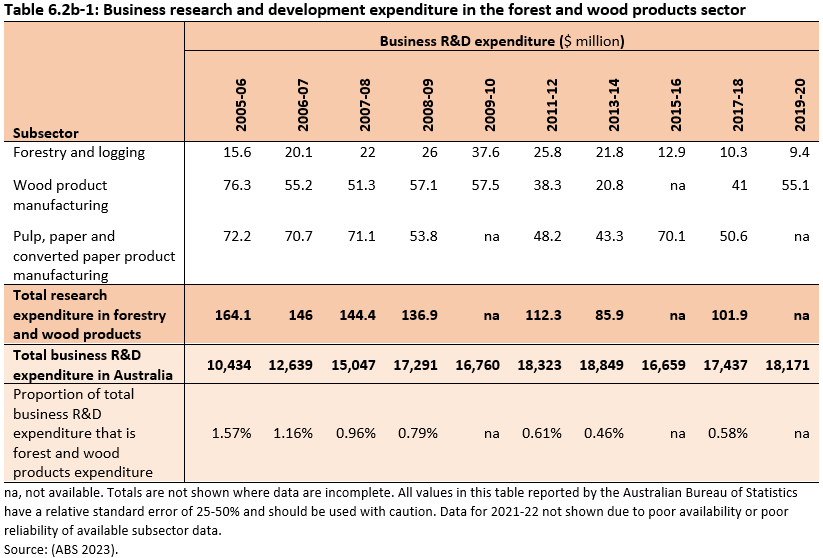
- Total R&D business expenditure in the forest and wood products sector decreased from $164 million in 2005-06 to $102 million in 2017-18 (the latest year of complete data).
Total research and development (R&D) business expenditure in the forest and wood products sector decreased from $164.1 million in 2005-06 to $101.9 million in 2017-18 (Table 6.2b-1), a decline of 53% when adjusted for inflation to 2019-20 values (ABS 2023). These data are published biennially by the Australian Bureau of Statistics, with only partial data available for 2019-20, and fewer data with poorer reliability available for 2021-22.
Forest-sector business R&D expenditure declined as a proportion of total business R&D expenditure in Australia from 1.57% in 2005-06 to 0.46% in 2013-14, increasing slightly to 0.58% in 2017-18; this increase was driven largely by increases in R&D expenditure on wood product manufacturing (ABS 2023).
Click here for a Microsoft Excel workbook of the data for Table 6.2b-1.
Business R&D expenditure is also reported across the three forest and wood products subsectors of the forest and wood products sector (Table 6.2b-1). Business R&D expenditure in:
- the forestry and logging subsector decreased from $15.6 million in 2005-06 (after rising to $37.6 million in 2009-10) to $9.4 million in 2019-20, a decline of 57% when adjusted for inflation to 2019-20 values. In this subsector R&D may focus on ways to improve wood production and harvesting of wood products, or on identifying new markets for standing wood (such as a market for reduced carbon emissions)
- the wood product manufacturing subsector decreased from $76.3 million in 2005-06 to $55.1 million in 2019-20, a decline of 47% when adjusted for inflation to 2019-20 values. In this subsector R&D aims to identify new forest-based products and methods for processed forest products (excluding pulp, paper and cardboard), such as new applications for timber in construction, new timber treatments, and the identification of new export markets
- the pulp, paper and converted paper product manufacturing subsector decreased from $72.2 million in 2005-06 to $50.6 million in 2017-18 (the latest year of complete data), a decline of 47% when adjusted for inflation to 2019-20 values. In this subsector R&D can cover energy efficiency in the pulping and drying of wood, and the development of new wood-based products.
For the reporting period, there was no separate industry subdivision classification that covers research on biofuels and bioenergy under the Australian and New Zealand Standard Industrial Classification (ANZSIC) 2006.
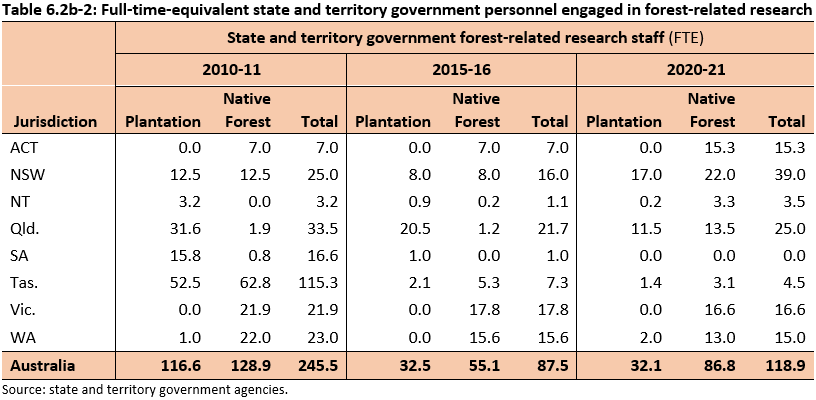
Data on the number of full-time-equivalent (FTE) state and territory government personnel engaged in forest-related research are presented here as an indication of levels of investment in research and development (R&D) (Table 6.2b-2). This is because data on government expenditure on forest-related R&D are not available. The FTE values are approximate and with low confidence for trends over time due to the difficulty of confirming the direct relevance of some research specifically to forests.
State and territory government research staff numbers increased from 2015-16 to 2020-21, with increases reported for the Australian Capital Territory, New South Wales and Queensland. There was a decline in research staff numbers for Tasmania. Non-government research staff were also funded by state governments in New South Wales, Queensland, South Australia, Tasmania and Victoria, however, data on the number of staff were not available.
Click here for a Microsoft Excel workbook of the data for Table 6.2b-2.
Increases in government research staff numbers could represent real increases in capacity or could result from restructuring of government agencies and inclusion of personnel not previously identified. The decline in Tasmania after 2010-11 likely resulted from downsizing of research arms of state agencies and government business enterprises.
Governments invest in research and development relating to forest management and forest-based industries through programs conducted by Commonwealth, state and territory agencies and departments, in collaboration with research providers such as universities and the Commonwealth Scientific and Industrial Research Organisation (CSIRO), and by matching industry funding through Research and Development Corporations, specifically Forest and Wood Products Australia. Descriptions of these various agencies and their general capacity and activities are contained in Indicator 7.1e.
Investment in, and adoption of, new technologies have taken place across a broad range of areas of activity during the period 2016 to 2024. Notable areas include extensive use of ground-based and airborne LiDAR (Light Detection and Ranging) and other remote sensing technologies, in situ measurement of wood properties in standing trees, and increased application of genomic technology in tree breeding.
Ground-based and airborne LiDAR are now being used extensively to monitor forest structure, condition and health in most Australian jurisdictions, supporting or replacing more costly and time-consuming methods of forest inventory. Artificial intelligence (AI) is increasingly being tested and applied to further improve the accuracy and efficiency of forest management technologies and practices, such as for wildlife recognition and monitoring, and fire detection.
Examples of new technologies adopted are presented in Supporting information for Indicator 6.2b.
Further information
- Industry definitions
- Data for reporting business research and development expenditure
- Adoption of new technologies – examples
- Data source


