
This indicator measures the consumption of forest-based products in Australia. Consumption trends over time provide a measure of the ability of Australian forest and timber industries, through both domestic production and importation, to meet Australian society’s demand for forest-based products and the industries contribution to the economy.
This is the Key information for Indicator 6.1d, published October 2024.
- Australia produced 4.3 million cubic metres of sawnwood in 2022-23, of which 89% was softwood and 11% was hardwood. Almost all (95%) Australian sawnwood was consumed within Australia, with the remaining 5% exported.
- Australia produced 2.9 million tonnes of paper and paperboard in 2022-23, including packaging and industrial paper, printing and writing paper, household and sanitary paper, and newsprint.
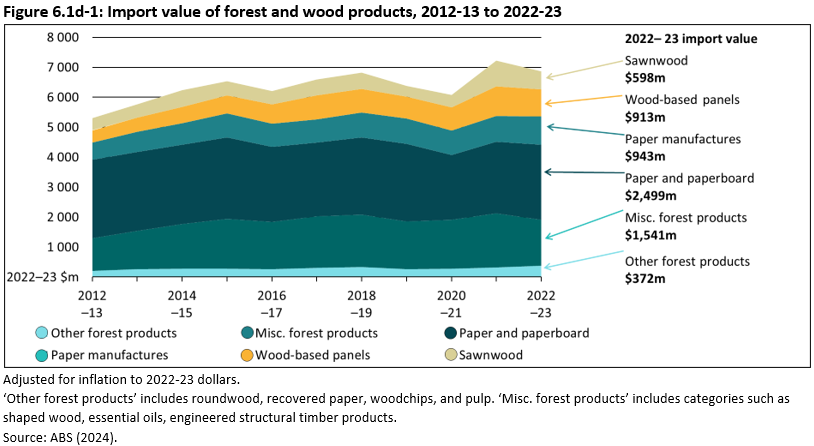
- The total value of imports of forest and wood products ($6.87 billion) in 2022-23 continued to exceed the total value of exports ($2.76 billion) for the same period.
- The total value of imports of forest and wood products decreased in 2022-23 in real terms (adjusted for inflation) after peaking in 2021-22.
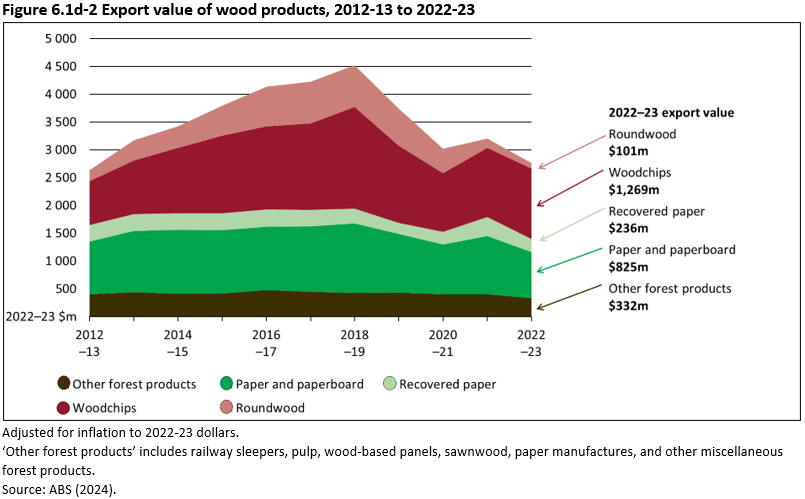
- The total value of exports of forest and wood products also decreased in 2022-23 in real terms (adjusted for inflation), continuing a declining trend since 2018-19.
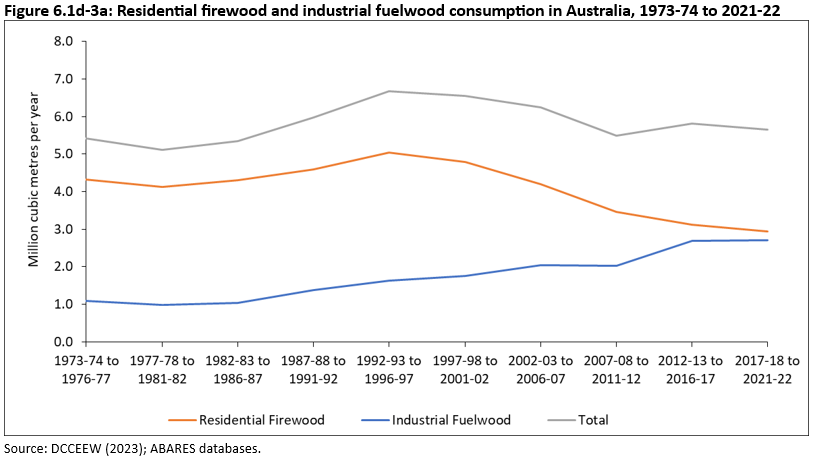
- An average of 5.7 million cubic metres of firewood and fuelwood was consumed annually in the 5-year period 2017-22.
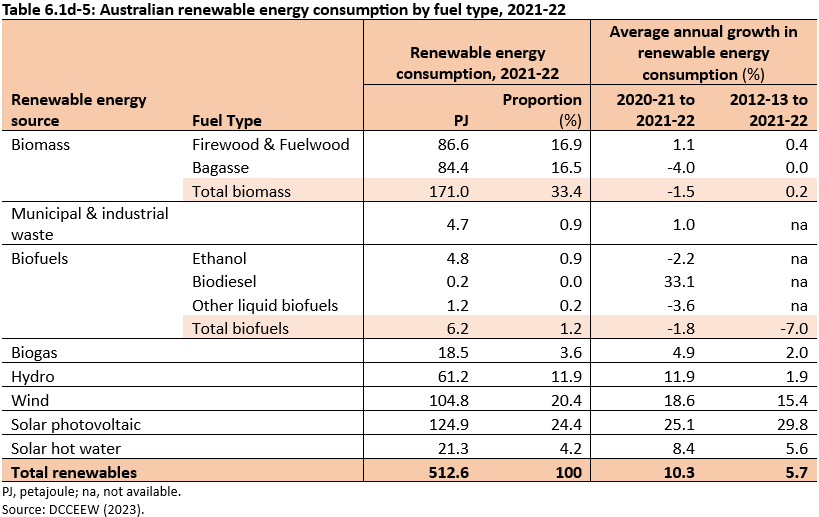
- Firewood and fuelwood provided 86.6 petajoules of renewable energy in Australia in 2021-22, (17% of total renewable energy consumption), and represents the third highest renewable energy fuel type consumed after solar photovoltaic and wind energy (24% and 20% respectively).
- Demand from Asian markets is the main determinant of Australian woodchip exports.
- Australian import markets for sawnwood are highly diversified, providing flexibility for the sector.
Australia produced 4.3 million cubic metres of sawnwood in 2022-23 (Table 6.1d-1). Most (89%) of this was softwood sawnwood, with the balance hardwood sawnwood (11%). Almost all (95%) Australian sawnwood was consumed within Australia, with the remaining 5% exported.
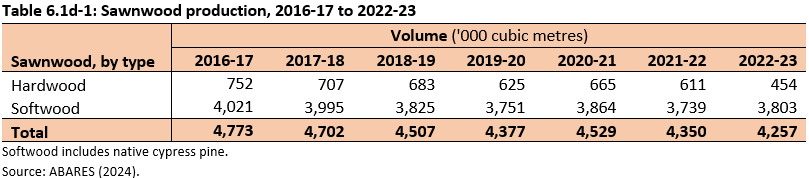
Click here for a Microsoft Excel workbook of the data for Table 6.1d-1.
In 2022-23, Australia’s apparent consumption of sawnwood totalled 4.8 million cubic metres (Table 6.1d-2), of which most (4.4 million cubic metres, 92%) was softwood sawnwood.
Softwood sawnwood is commonly used in housing construction for structural framing, and has other applications including furniture, decking and flooring. Domestic residential dwelling commencements are a key factor influencing softwood sawnwood consumption (ABARES 2023). Hardwood sawnwood is generally used where strength and/or durability are important and for decorative purposes, such as for flooring, decking, cladding, joinery and furniture.
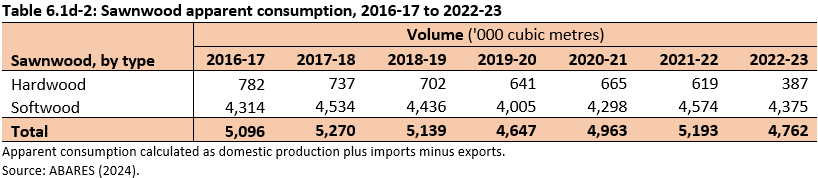
Click here for a Microsoft Excel workbook of the data for Table 6.1d-2.
The paper and paperboard category of wood products includes packaging and industrial paper, printing and writing paper, household and sanitary paper, and newsprint.
Australia produced 2.9 million tonnes of paper and paperboard in 2022-23 (Table 6.1d-3). This included:
- 2.3 million tonnes of packaging and industrial paper
- 0.2 million tonnes of printing and writing paper
- 0.3 million tonnes of household and sanitary paper.
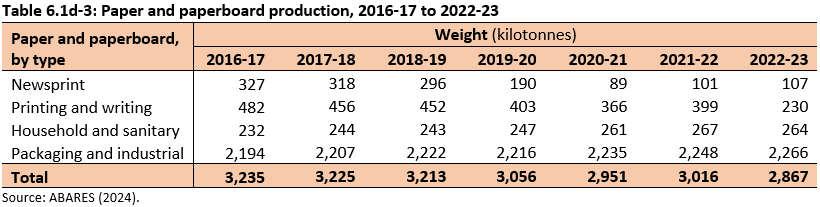
Click here for a Microsoft Excel workbook of the data for Table 6.1d-3.
Australians consumed 3.1 million tonnes of paper and paperboard products in 2022-23. Demand for newsprint and printing and writing paper has fallen in recent years as paper has increasingly been replaced by electronic resources, only partially offset by increasing demand for packaging and industrial paper with the rise of e commerce. This has resulted in changes in paper and paperboard consumption, production and trade.
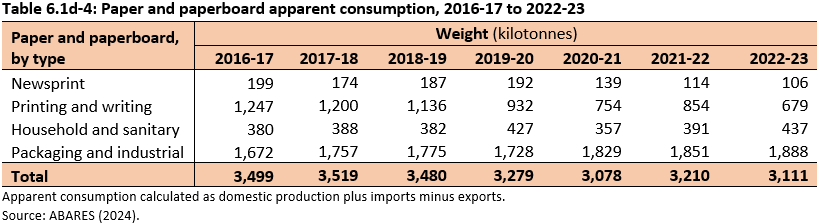
Click here for a Microsoft Excel workbook of the data for Table 6.1d-4.
Trade is an important component and driver of the value of Australian forest and wood products. In 2022-23, total merchandise trade (sum of imports and exports) for forest and wood products reached $9.63 billion.
Imports of forest and wood products
In 2022-23, the value of forest and wood product imports increased by 1.8% (a 4.9% decline in real terms, i.e. adjusted for inflation) to $6.87 billion from 2021-22 (Figure 6.1d-1), reflecting a slowdown in the housing construction activity.
Click here for a Microsoft Excel workbook of the data for Figure 6.1d-1.
Between 2012-13 and 2018-19, growth in the real value (values adjusted for inflation) of imports was driven by growth in miscellaneous forest product imports (primarily mouldings and other wood articles from China and Indonesia), and to a lesser extent, by growth in wood-based panel imports (primarily plywood from China). Both categories are strongly associated with domestic construction activity and therefore reflect the growing demand from that sector during that period.
The value of imported wood products peaked in real terms (adjusted for inflation) in 2021-22, with a 19% year on year increase from 2020-21, following COVID-19 domestic stimulus programs focused on the construction sector. As the stimulus programs have ended and domestic demand for wood products is easing, the value of imports is declining and is expected to return to more average levels in coming years.
Imports of sawnwood
The value of sawnwood imports increased in 2021-22 above historical levels due to COVID-19 domestic stimulus of the residential construction sector. In 2022-23, the value of sawnwood imports was $598 million. The responsiveness of imports to an increase in demand showed that Australian import markets are well diversified and offer an important flexibility in accessing product from international markets when required on a short-term basis.
Across the sawnwood category, in 2022-23 New Zealand was the source of 21% of imports, followed by Germany (14%) and Lithuania (12%). The remainder of sawnwood imports were sourced from a range of other countries, primarily in Europe. As demand from the residential construction sector eases, the value of sawnwood imports is expected to continue to decline.
Imports of wood-based panels
Wood-based panels accounted for 15% of the value of Australian imports in 2022-23, and the category has been growing steadily in recent years. The primary wood-based panel import to Australia was plywood (76% of value of wood-based panel imports in 2022-23), which is commonly used for structural applications in housing construction. Most of the wood-based panels imported in 2022-23 were from China (52% by value), with smaller shares coming from Indonesia and Malaysia (both 7%).
Growing Australian imports of wood-based panels was in line with expectations globally that demand for panels will grow more strongly than other product categories in the future. Between 2020 and 2050, the Food and Agriculture Organization of the United Nations (FAO) estimates that demand for veneer/plywood may double, and demand for particle/fibreboard may increase by 72%. These figures are compared to estimated increases in demand for sawnwood of 30%, and 5% for pulpwood (FAO 2022).
Exports of forest and wood products
The value of Australian exports of forest and wood products in 2022-23 has continued a declining trend since 2018-19. In 2022-23, the value of exports was $2.76 billion, a 7.7% decrease (13.8% in real terms, adjusted for inflation) from 2021-22. Woodchips continue to be the major export category, representing 46% of Australia’s total export value, followed by paper and paperboard representing 30% of export value (Figure 6.1d-2).
Click here for a Microsoft Excel workbook of the data for Figure 6.1d-2.
Between 2012-13 and 2018-19, growth in the real value of exports (adjusted for inflation) was driven by growth mainly in woodchip and roundwood exports. Over this period, increasing demand from China for both of these product categories drove the real value increase in Australia's export earnings for woodchip and roundwood products.
Exports of paper and paper board
Australian exports of paper and paper board were worth $825 million in 2022-23, a 16% decline from 2021-22 (21% in real terms, adjusted for inflation), returning to levels similar to 2020-21. Demand for Australia’s paper and paperboard exports was driven by global demand for packaging and industrial paper which was used largely for e commerce (89% of total paper and paperboard exports in 2022-23) and for printing and writing paper, both of which have been negatively impacted by slow global economic growth and interest rate rises.
Exports of roundwood
Following the Chinese ban on Australian softwood logs imposed in November 2020, the value of roundwood exports has been subject to strong decline. In 2022-23, roundwood exports declined by 36% (40% in real terms, i.e. adjusted for inflation) from 2021-22 levels, to $101 million. A peak value of $653 million in nominal terms (unadjusted for inflation) was exported in 2018-19.
Exports of woodchips
The value of Australian woodchip exports was $1.27 billion in 2022-23, with trade almost exclusively directed towards the Chinese and Japanese markets to manufacture paper products. Smaller volumes were also exported to Taiwan and Indonesia. Despite a gradual increase in value between 2020-21 and 2022-23, Australian woodchip exports are likely to face a growing pressure from Vietnam, which is now supplying almost 60% of the hardwood woodchip trade in the Asia Pacific region (Margules Groome 2024).
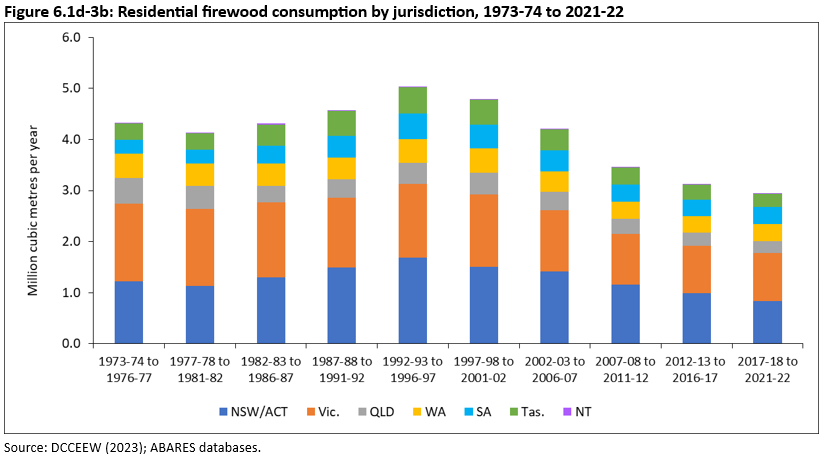
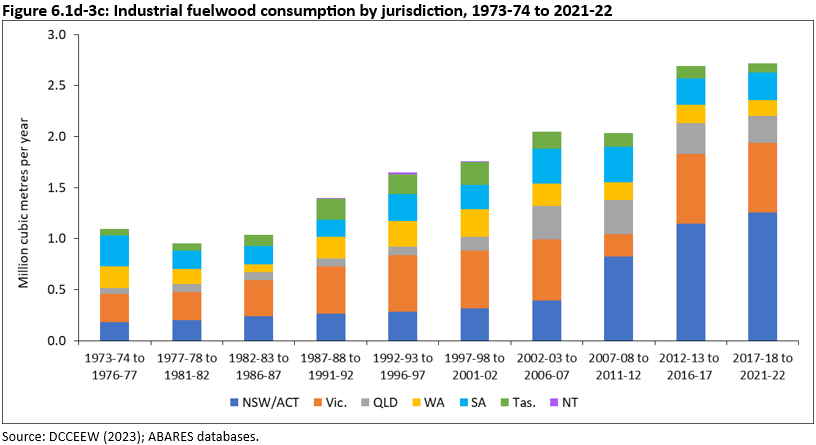
Between 2017-18 and 2021-22, annual average consumption of firewood and fuelwood in Australia was 5.7 million cubic metres per year. Residential firewood use has been steadily declining since the mid-1990s, and decreased by 15% in the 10 years to 2021-22. In contrast, industrial fuelwood use has been steadily increasing, and consumption was up 34% in the 10 years to 2021-22 (Figure 6.1d-3a). New South Wales (including the Australian Capital Territory) and Victoria consume the largest amounts of residential firewood and the largest amounts of industrial fuelwood (Figure 6.1d-3b and c).
Click here for a Microsoft Excel workbook of the data for Figure 6.1d-3a.
Firewood is one of the most widely utilised wood products, and is collected from native forests and commercial plantations across a range of tenures. Firewood consumption is an important part of the forestry sector, with many small-to-medium businesses involved with firewood processing, sales and distribution. Firewood is particularly important in regional communities, where a higher proportion of people reported using it as an energy source than in capital cities (Romanach and Frederiks 2020).
Click here for a Microsoft Excel workbook of the data for Figure 6.1d-3b.
Click here for a Microsoft Excel workbook of the data for Figure 6.1d-3c.
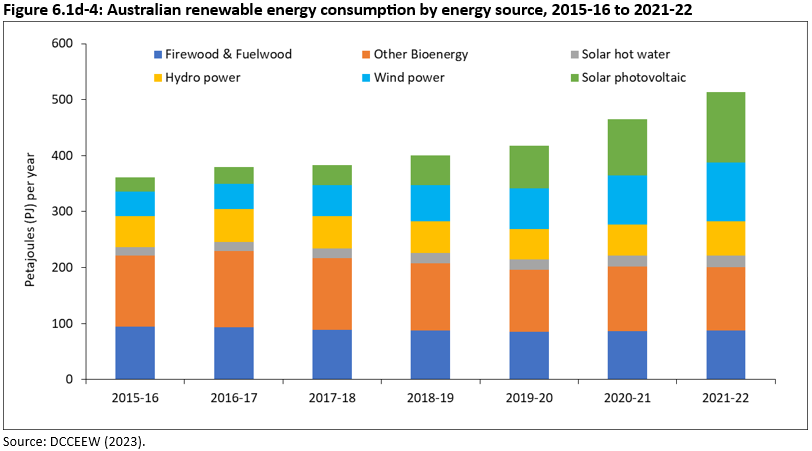
In 2021-22, firewood and fuelwood provided 86.6 petajoules (PJ) of renewable energy in Australia (17% of total renewable energy consumption; Table 6.1d-5). Firewood and fuelwood were the third highest renewable energy fuel type consumed, after solar photovoltaic and wind energy (24% and 20% respectively). Over recent years, the combined consumption of energy produced by firewood and fuelwood has remained at a consistent level. In contrast, the consumption of solar photovoltaic and wind energy has increased considerably (Figure 6.1d-4).
Click here for a Microsoft Excel workbook of the data for Table 6.1d-5.
Click here for a Microsoft Excel workbook of the data for Figure 6.1d-4.
Industrial fuelwood was used to generate an annual average of 44.0 PJ of energy during the period 2017-18 to 2021-22 (DCCEEW 2023). Of this, an annual average of 27.4 PJ was used by the manufacturing sector, including 19.8 PJ in the wood and wood products and pulp, paper and printing industries. This was primarily achieved through the combustion of waste products from manufacturing processes, such as sawdust from sawn timber production.
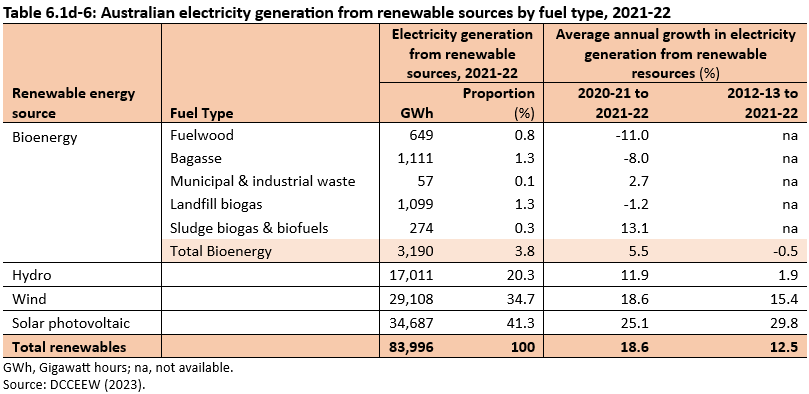
Some of the industrial fuelwood consumed is used to generate electricity. In 2021-22, fuelwood generated 649 gigawatt-hours of electricity, or 0.8% of the total production of electricity from renewable sources (Table 6.1d-6).
Click here for a Microsoft Excel workbook of the data for Table 6.1d-6.
The Australian forest and wood products statistics publication (ABARES 2024) is the source for information presented on production and consumption, and imports and exports.
The Australian Energy Update 2023 publication (DCCEEW 2023) is the main source of information presented on firewood, fuelwood and energy.
ABARES (2023). Australian forest and wood products statistics, March and June quarters 2023, ABARES series report, Australian Bureau of Agricultural and Resource Economics and Sciences, Canberra, November. CC By 4.0. doi.org/10.25814/x3cp-5k63
ABARES (2024). Australian forest and wood products statistics, Production to 2022-23, ABARES series report, Australian Bureau of Agricultural and Resource Economics and Sciences, Canberra, August, CC BY 4.0. doi.org/10.25814/PZH6-3W22
ABS (2024). International Trade in Goods, March 2024. Australian Bureau of Statistics, Canberra.
DCCEEW (2023). Australian Energy Update 2023. Australian Government Department of Climate Change, Energy, the Environment and Water, Canberra.
FAO (2022). Global forest sector outlook 2050: Assessing future demand and sources of timber for a sustainable economy, Food and Agriculture Organization of the United Nations, Rome. doi.org/10.4060/cc2265en
Romanach L and Fredericks E (2020). Residential Firewood Consumption in Australia. CSIRO Australia.
Margules Groome (2024). Forest Sector Outlook: Quarterly Edition 2024-Q1, Global Consulting Alliance.