
Publication date: 28 November 2024
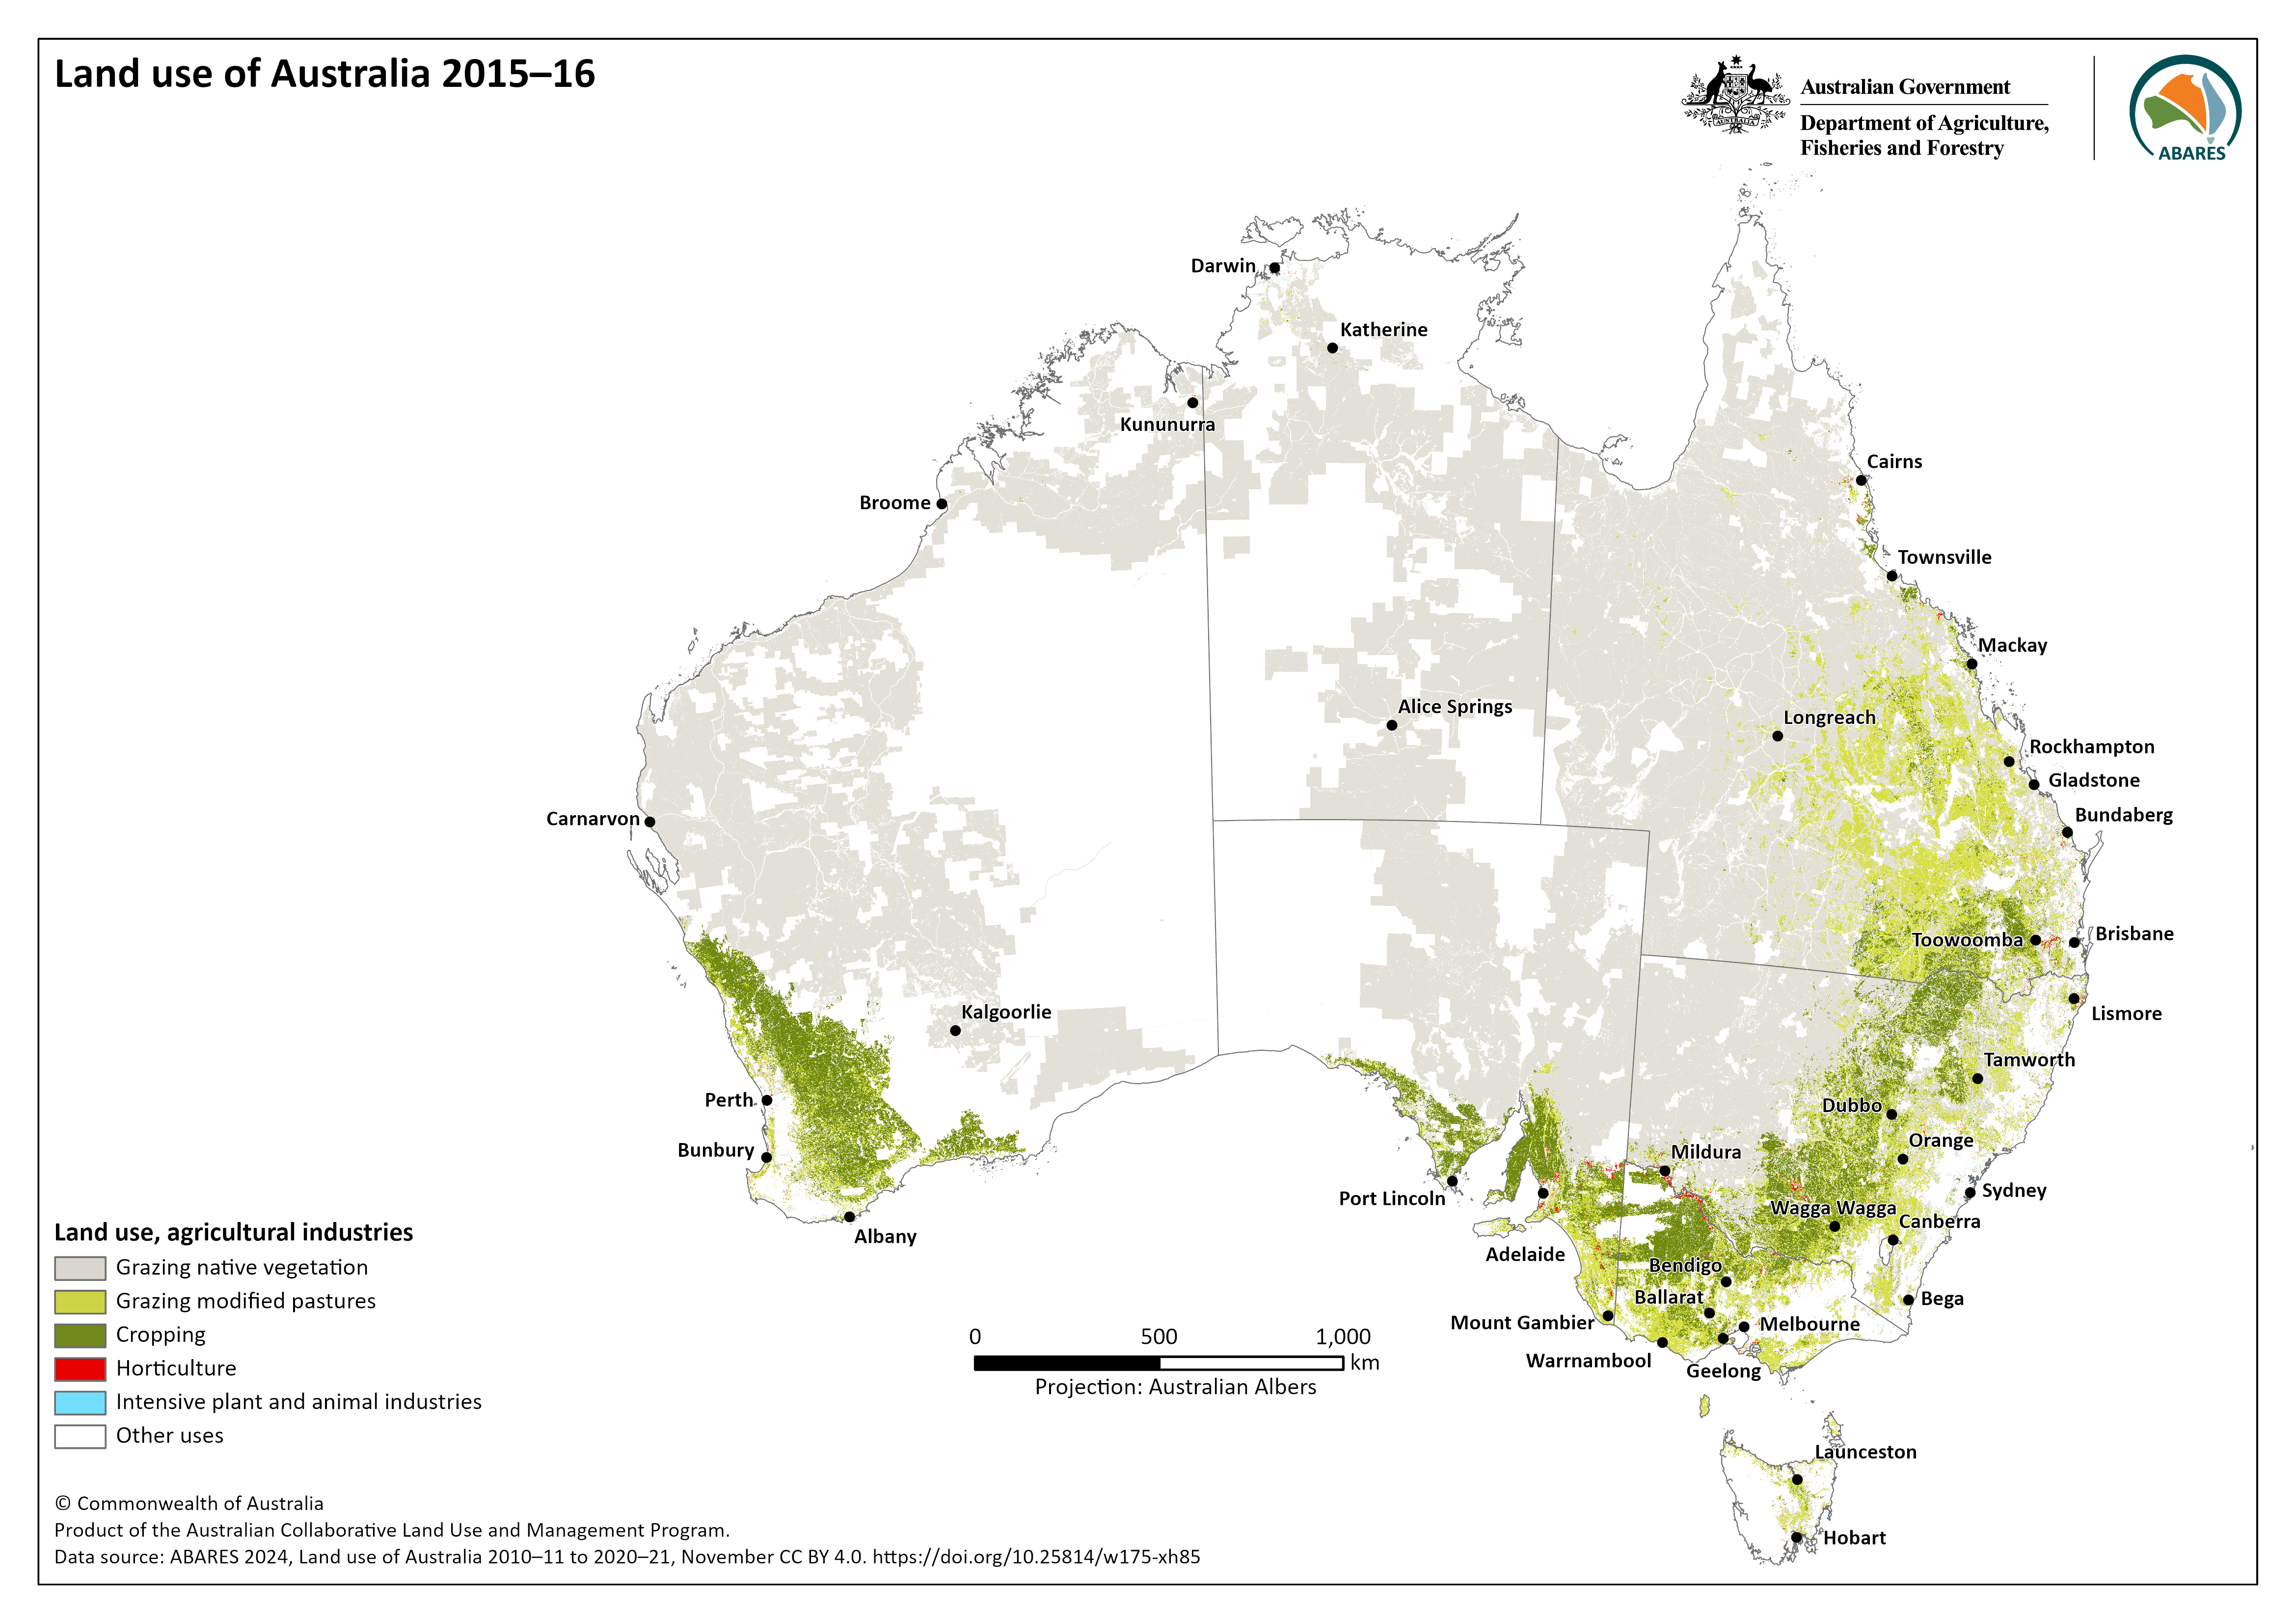
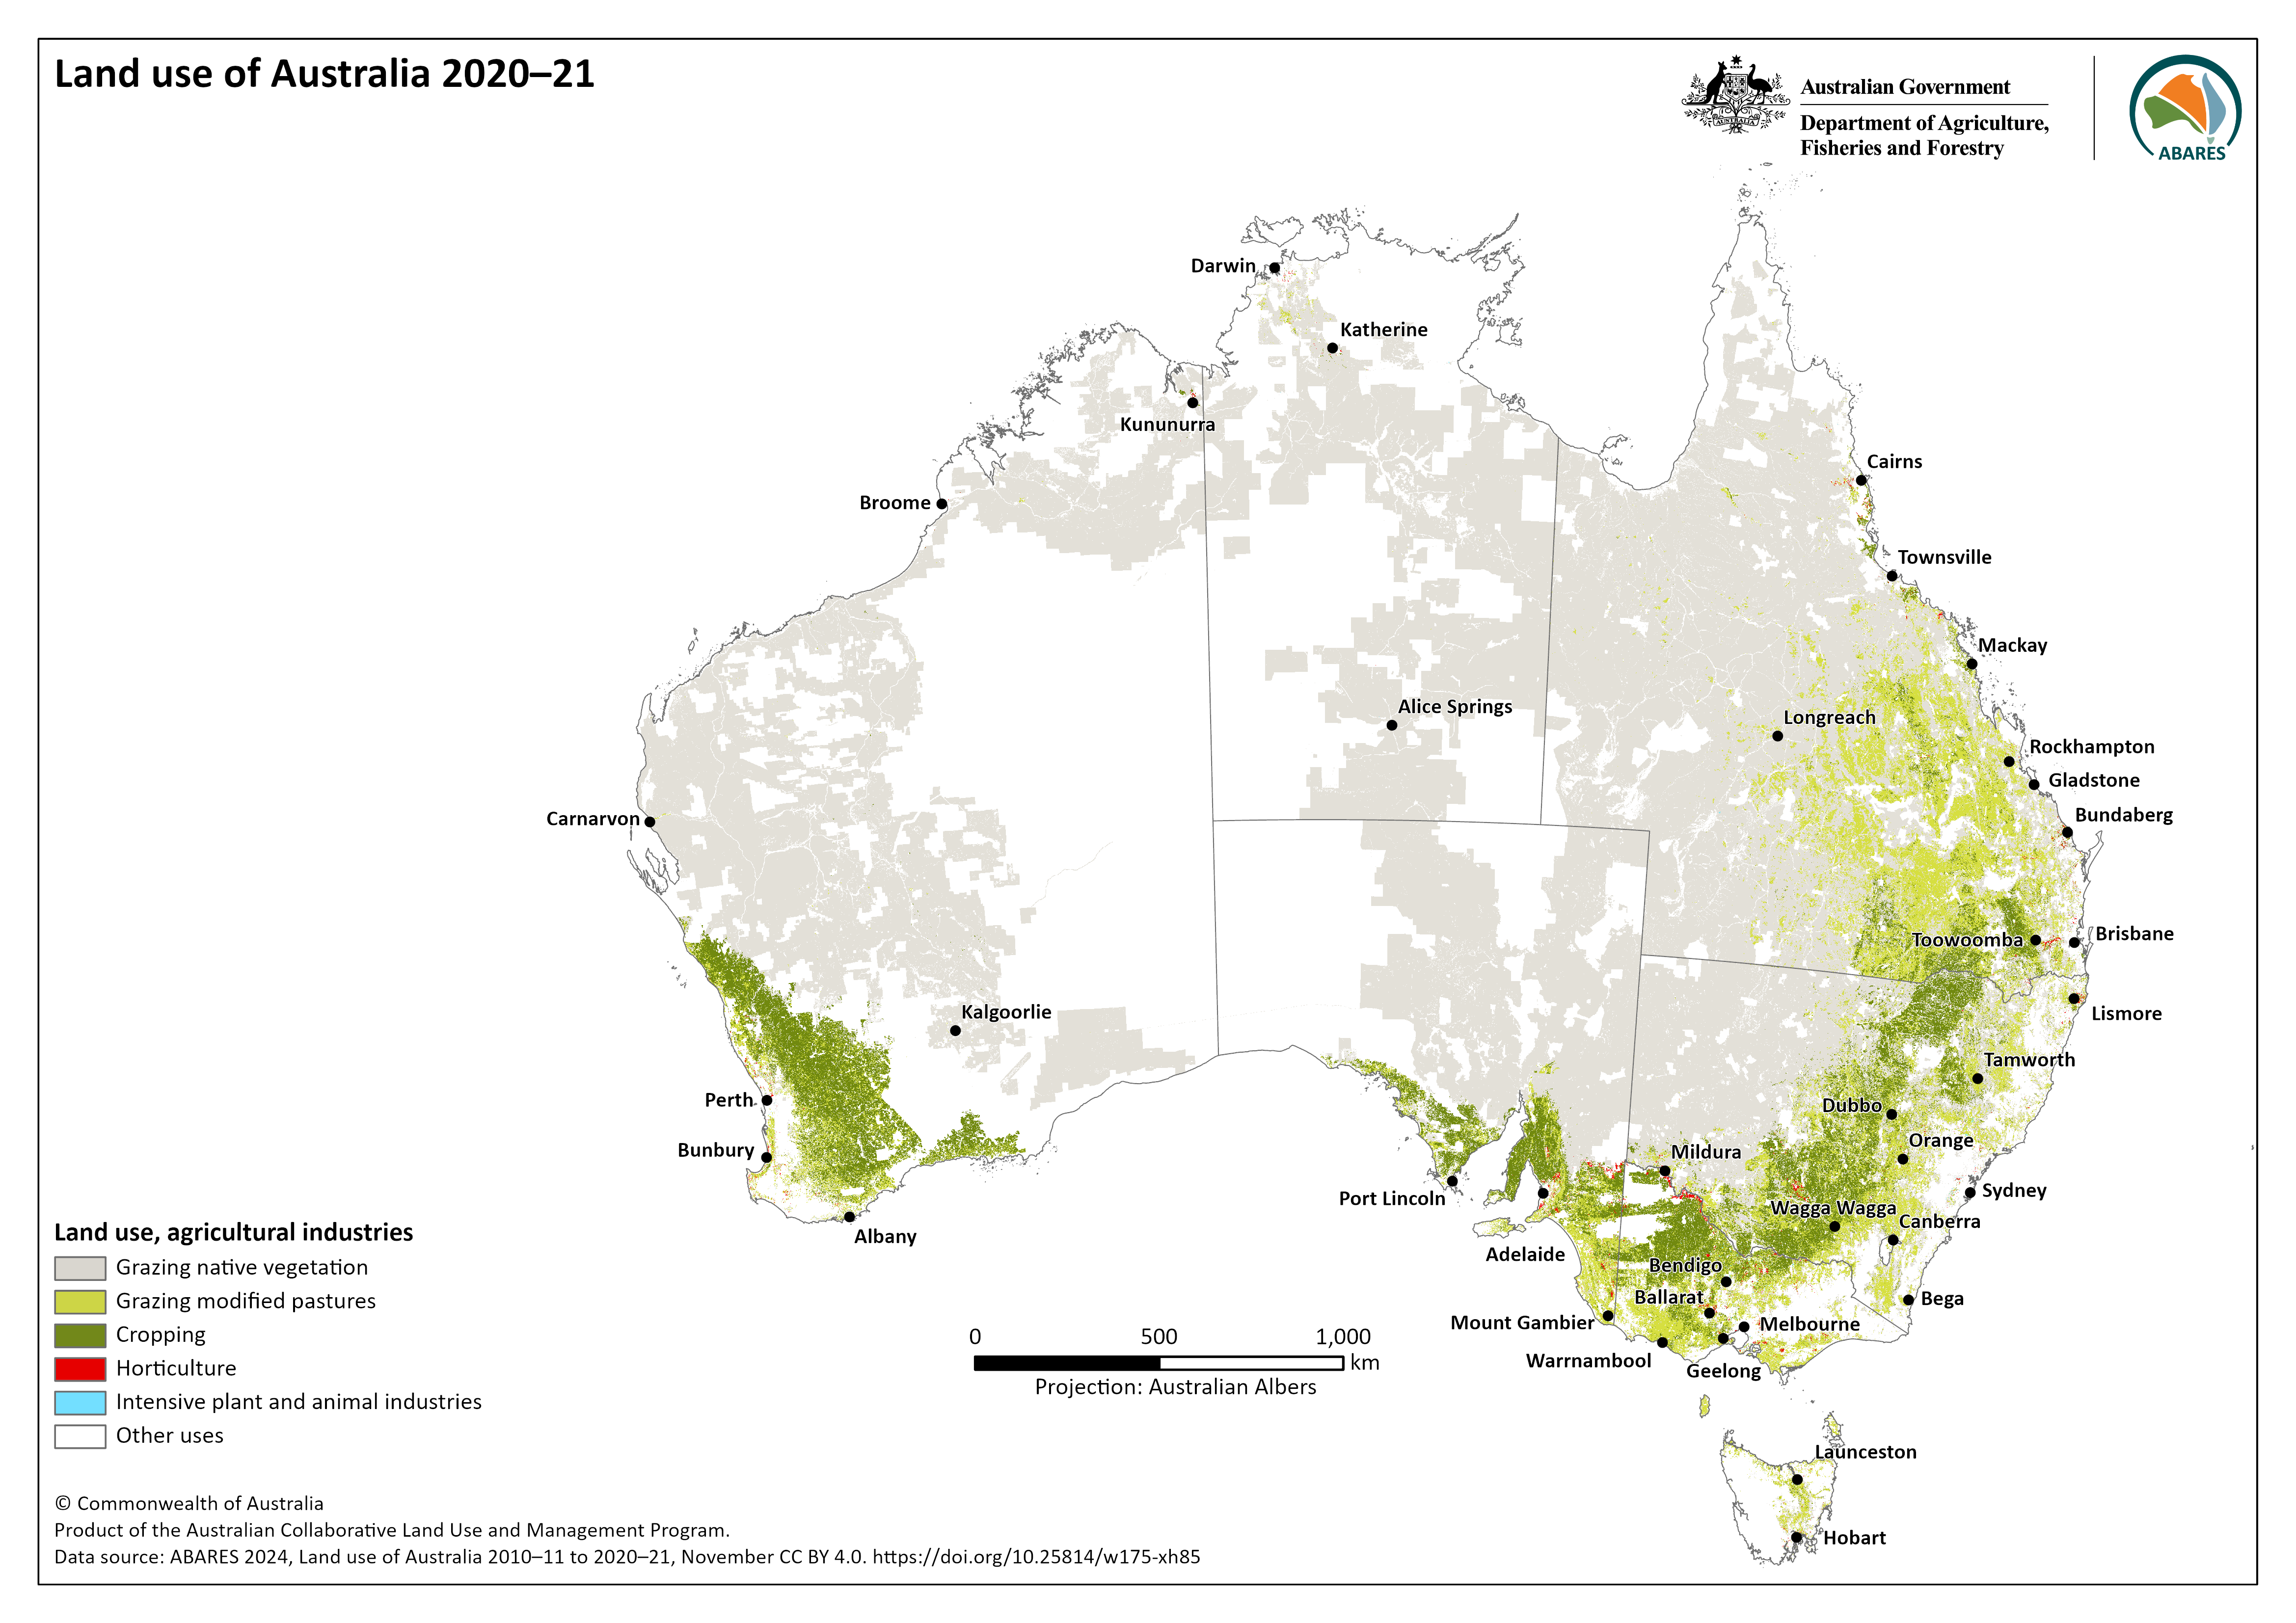
The Land use of Australia 2010–11 to 2020–21 data package consists of seamless continental rasters of land use at the national scale which provides the spatial representation of how Australia’s land resources are used. Data is for 2010–11, 2015–16 and 2020–21, and the associated changes between the years. Land use is specified according to the Australian Land Use and Management (ALUM) Classification version 8. The Land use of Australia 2010–11 to 2020–21 data package is a product of the Australian Collaborative Land Use and Management Program.
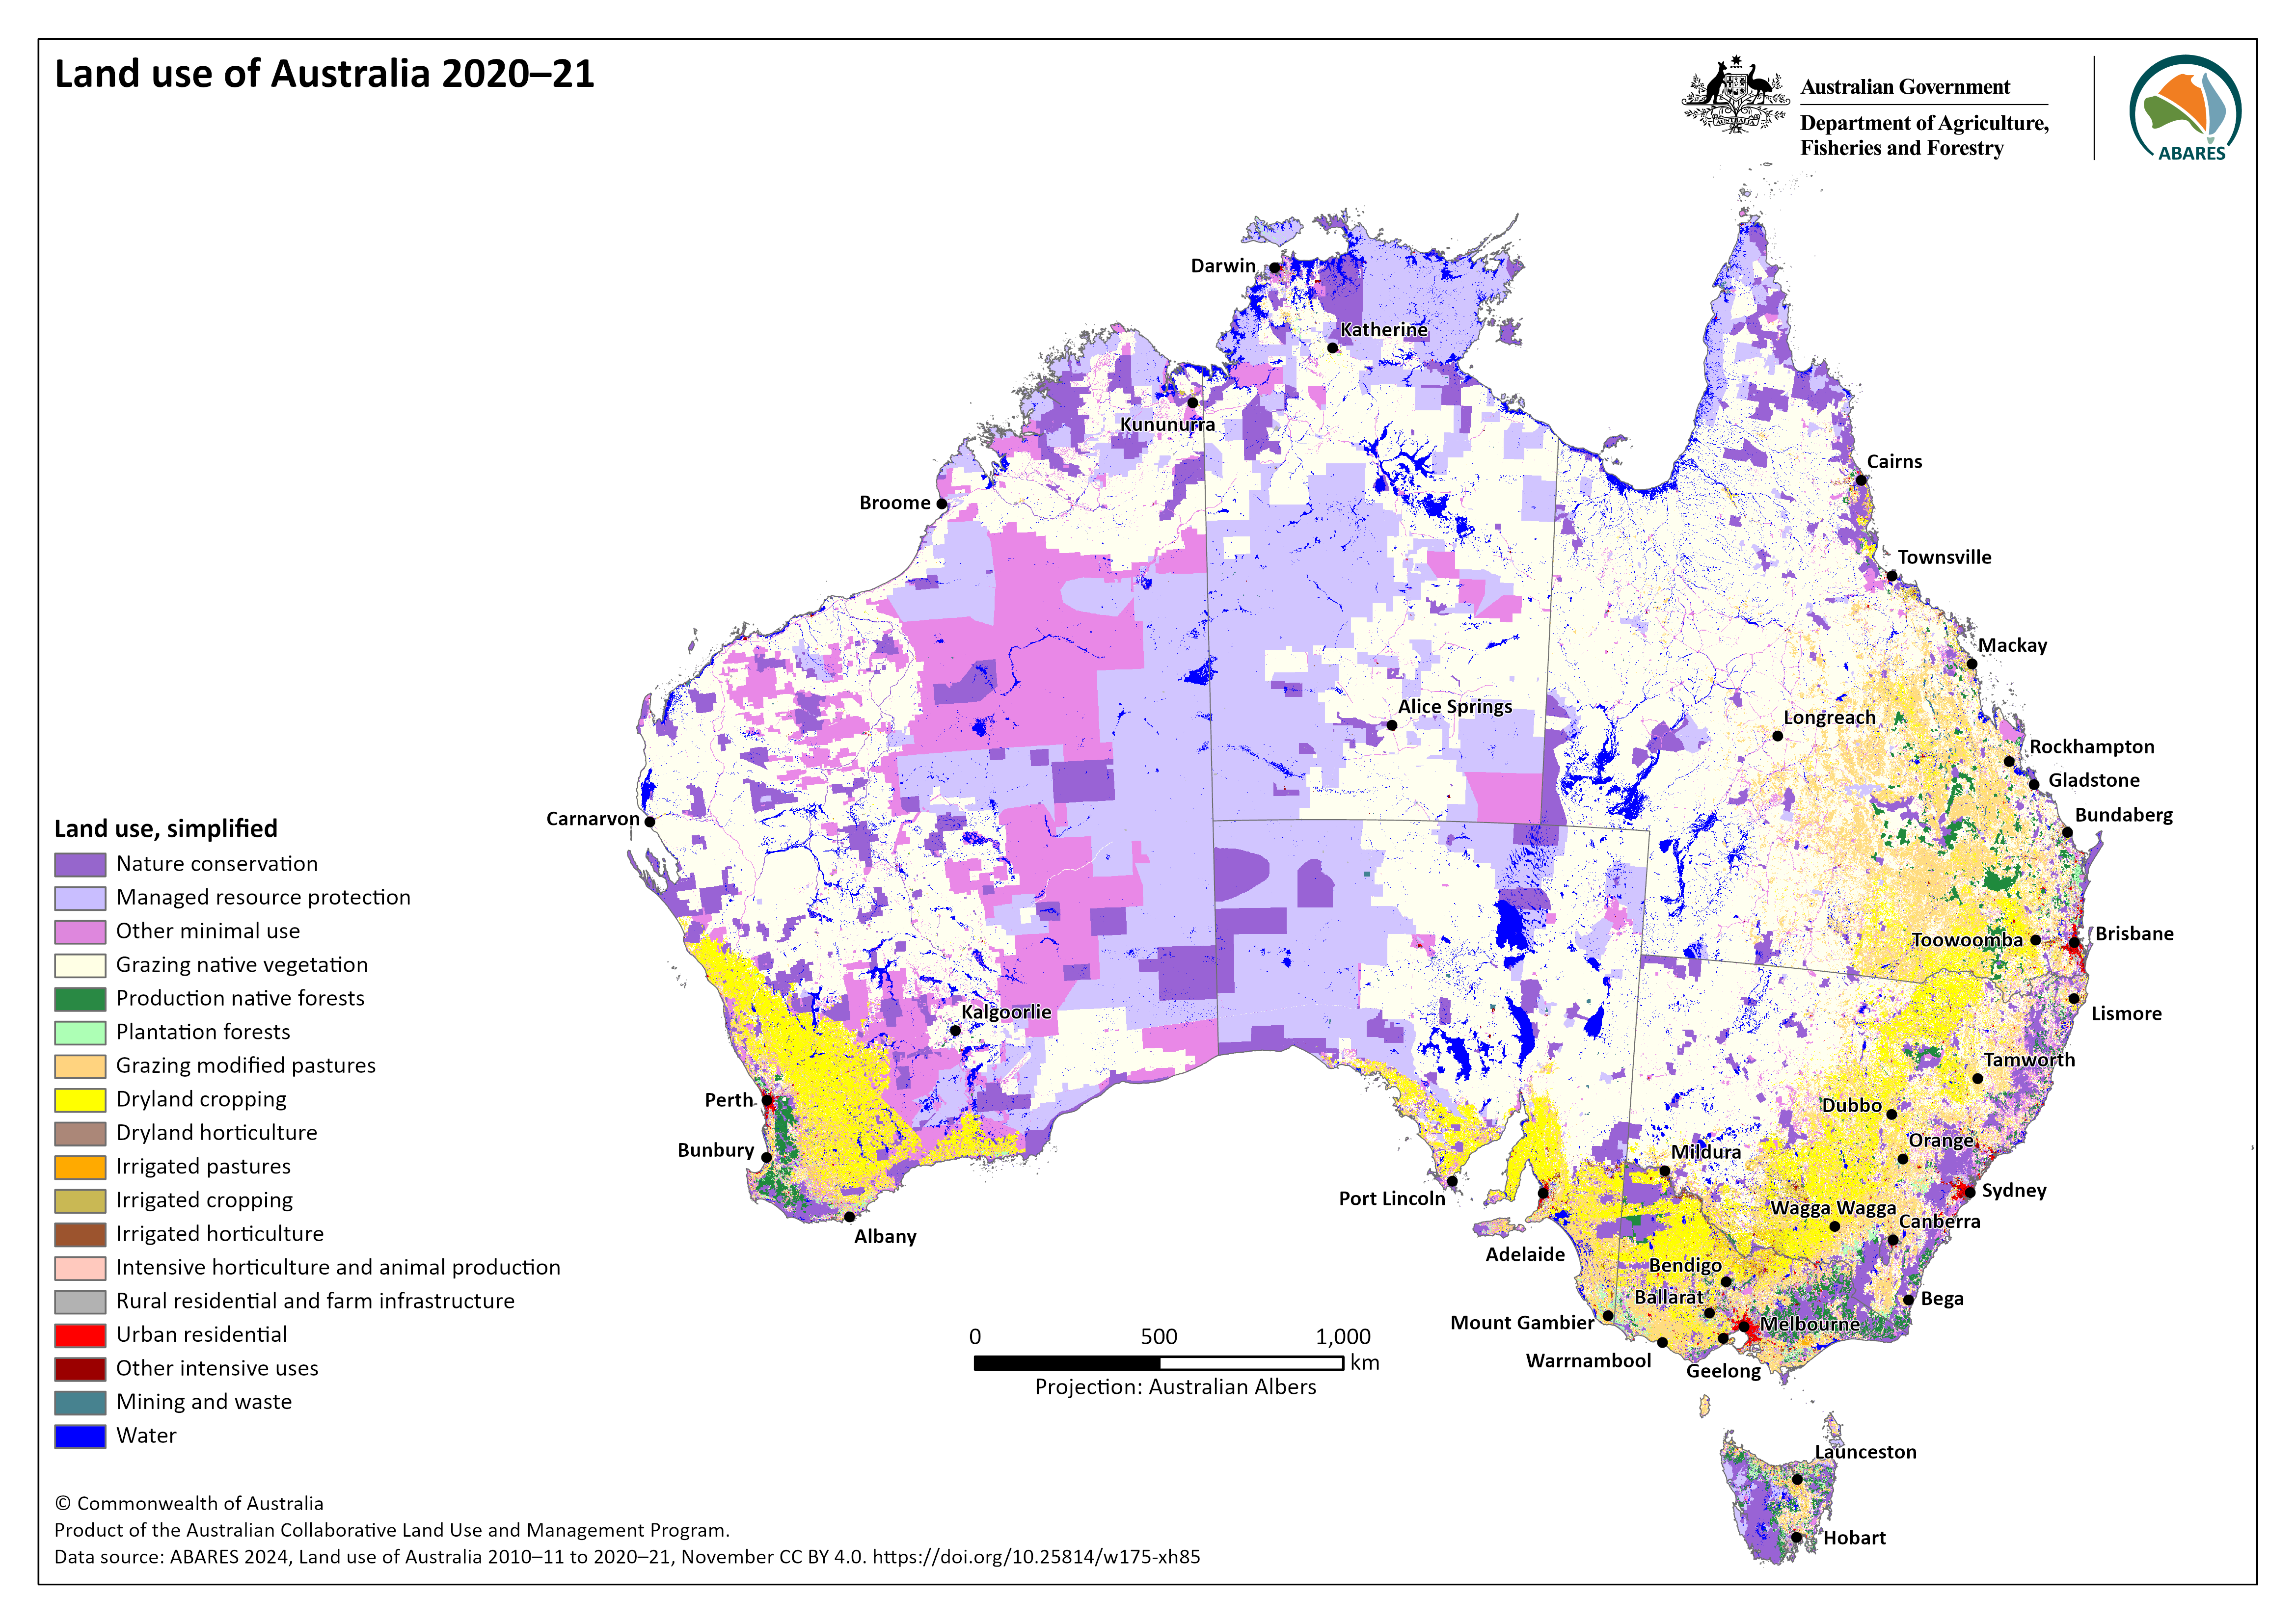
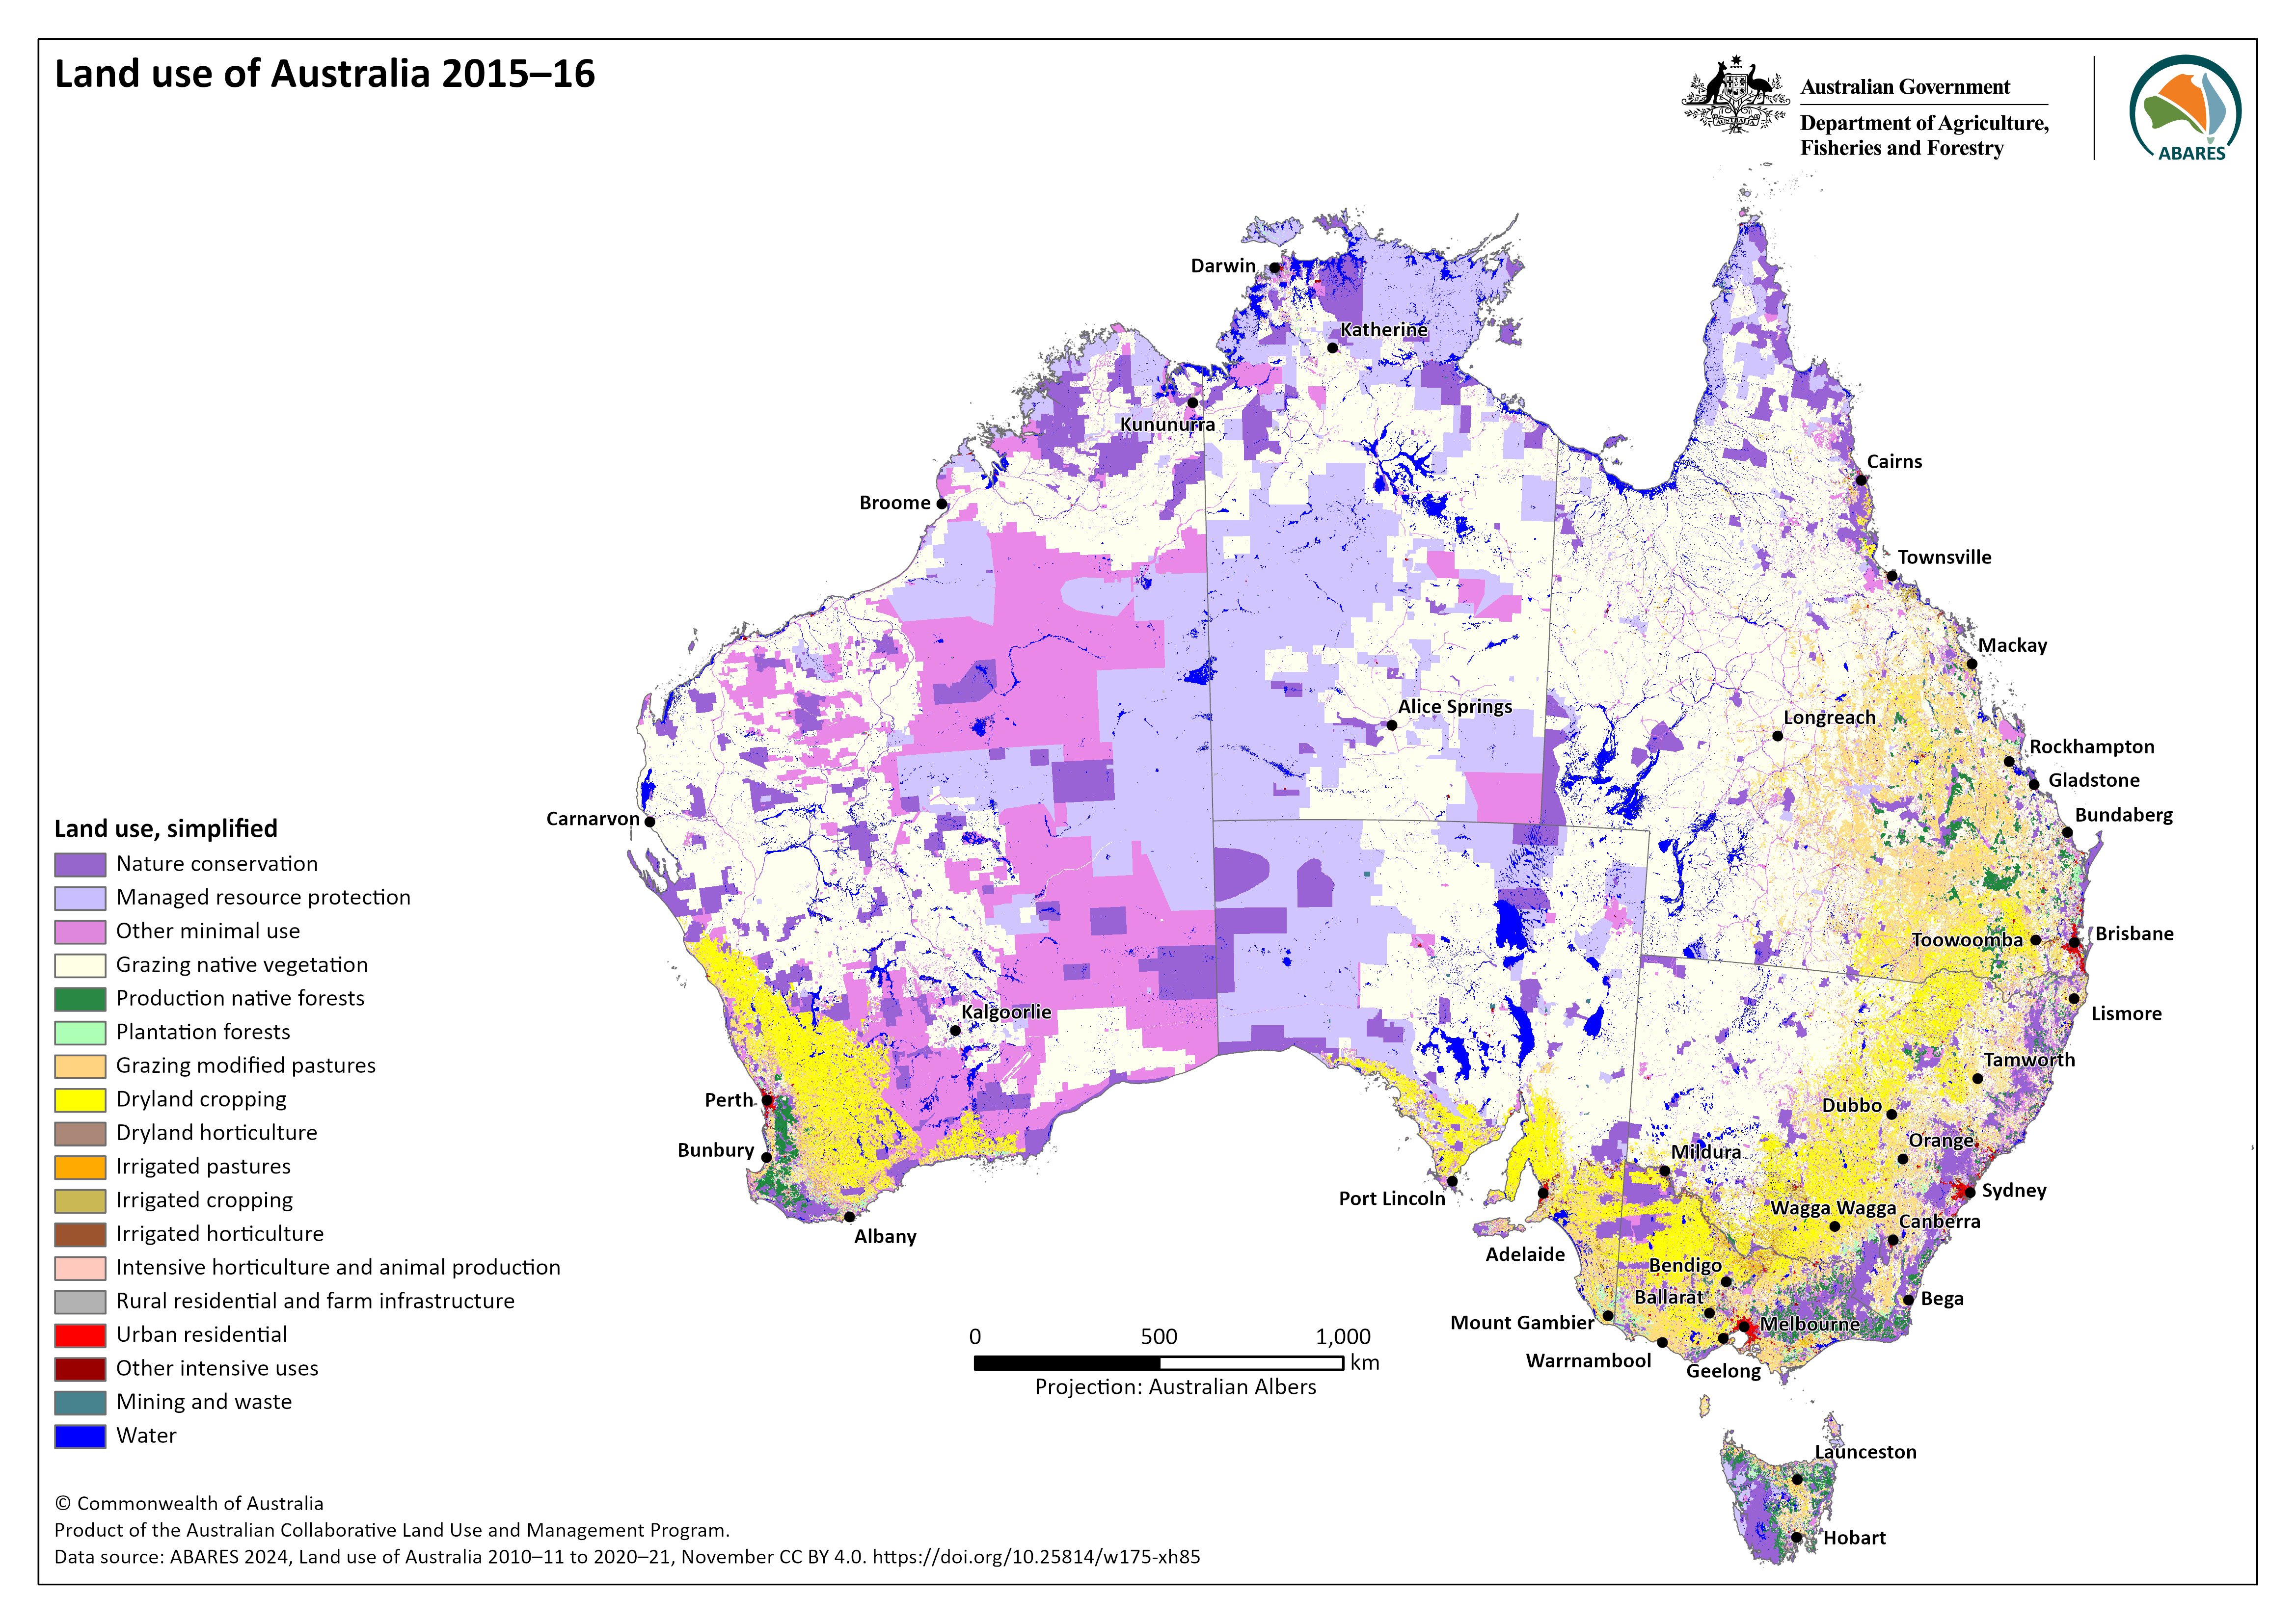
Map 1. Land use of Australia 2020–21 showing simplified land use classes
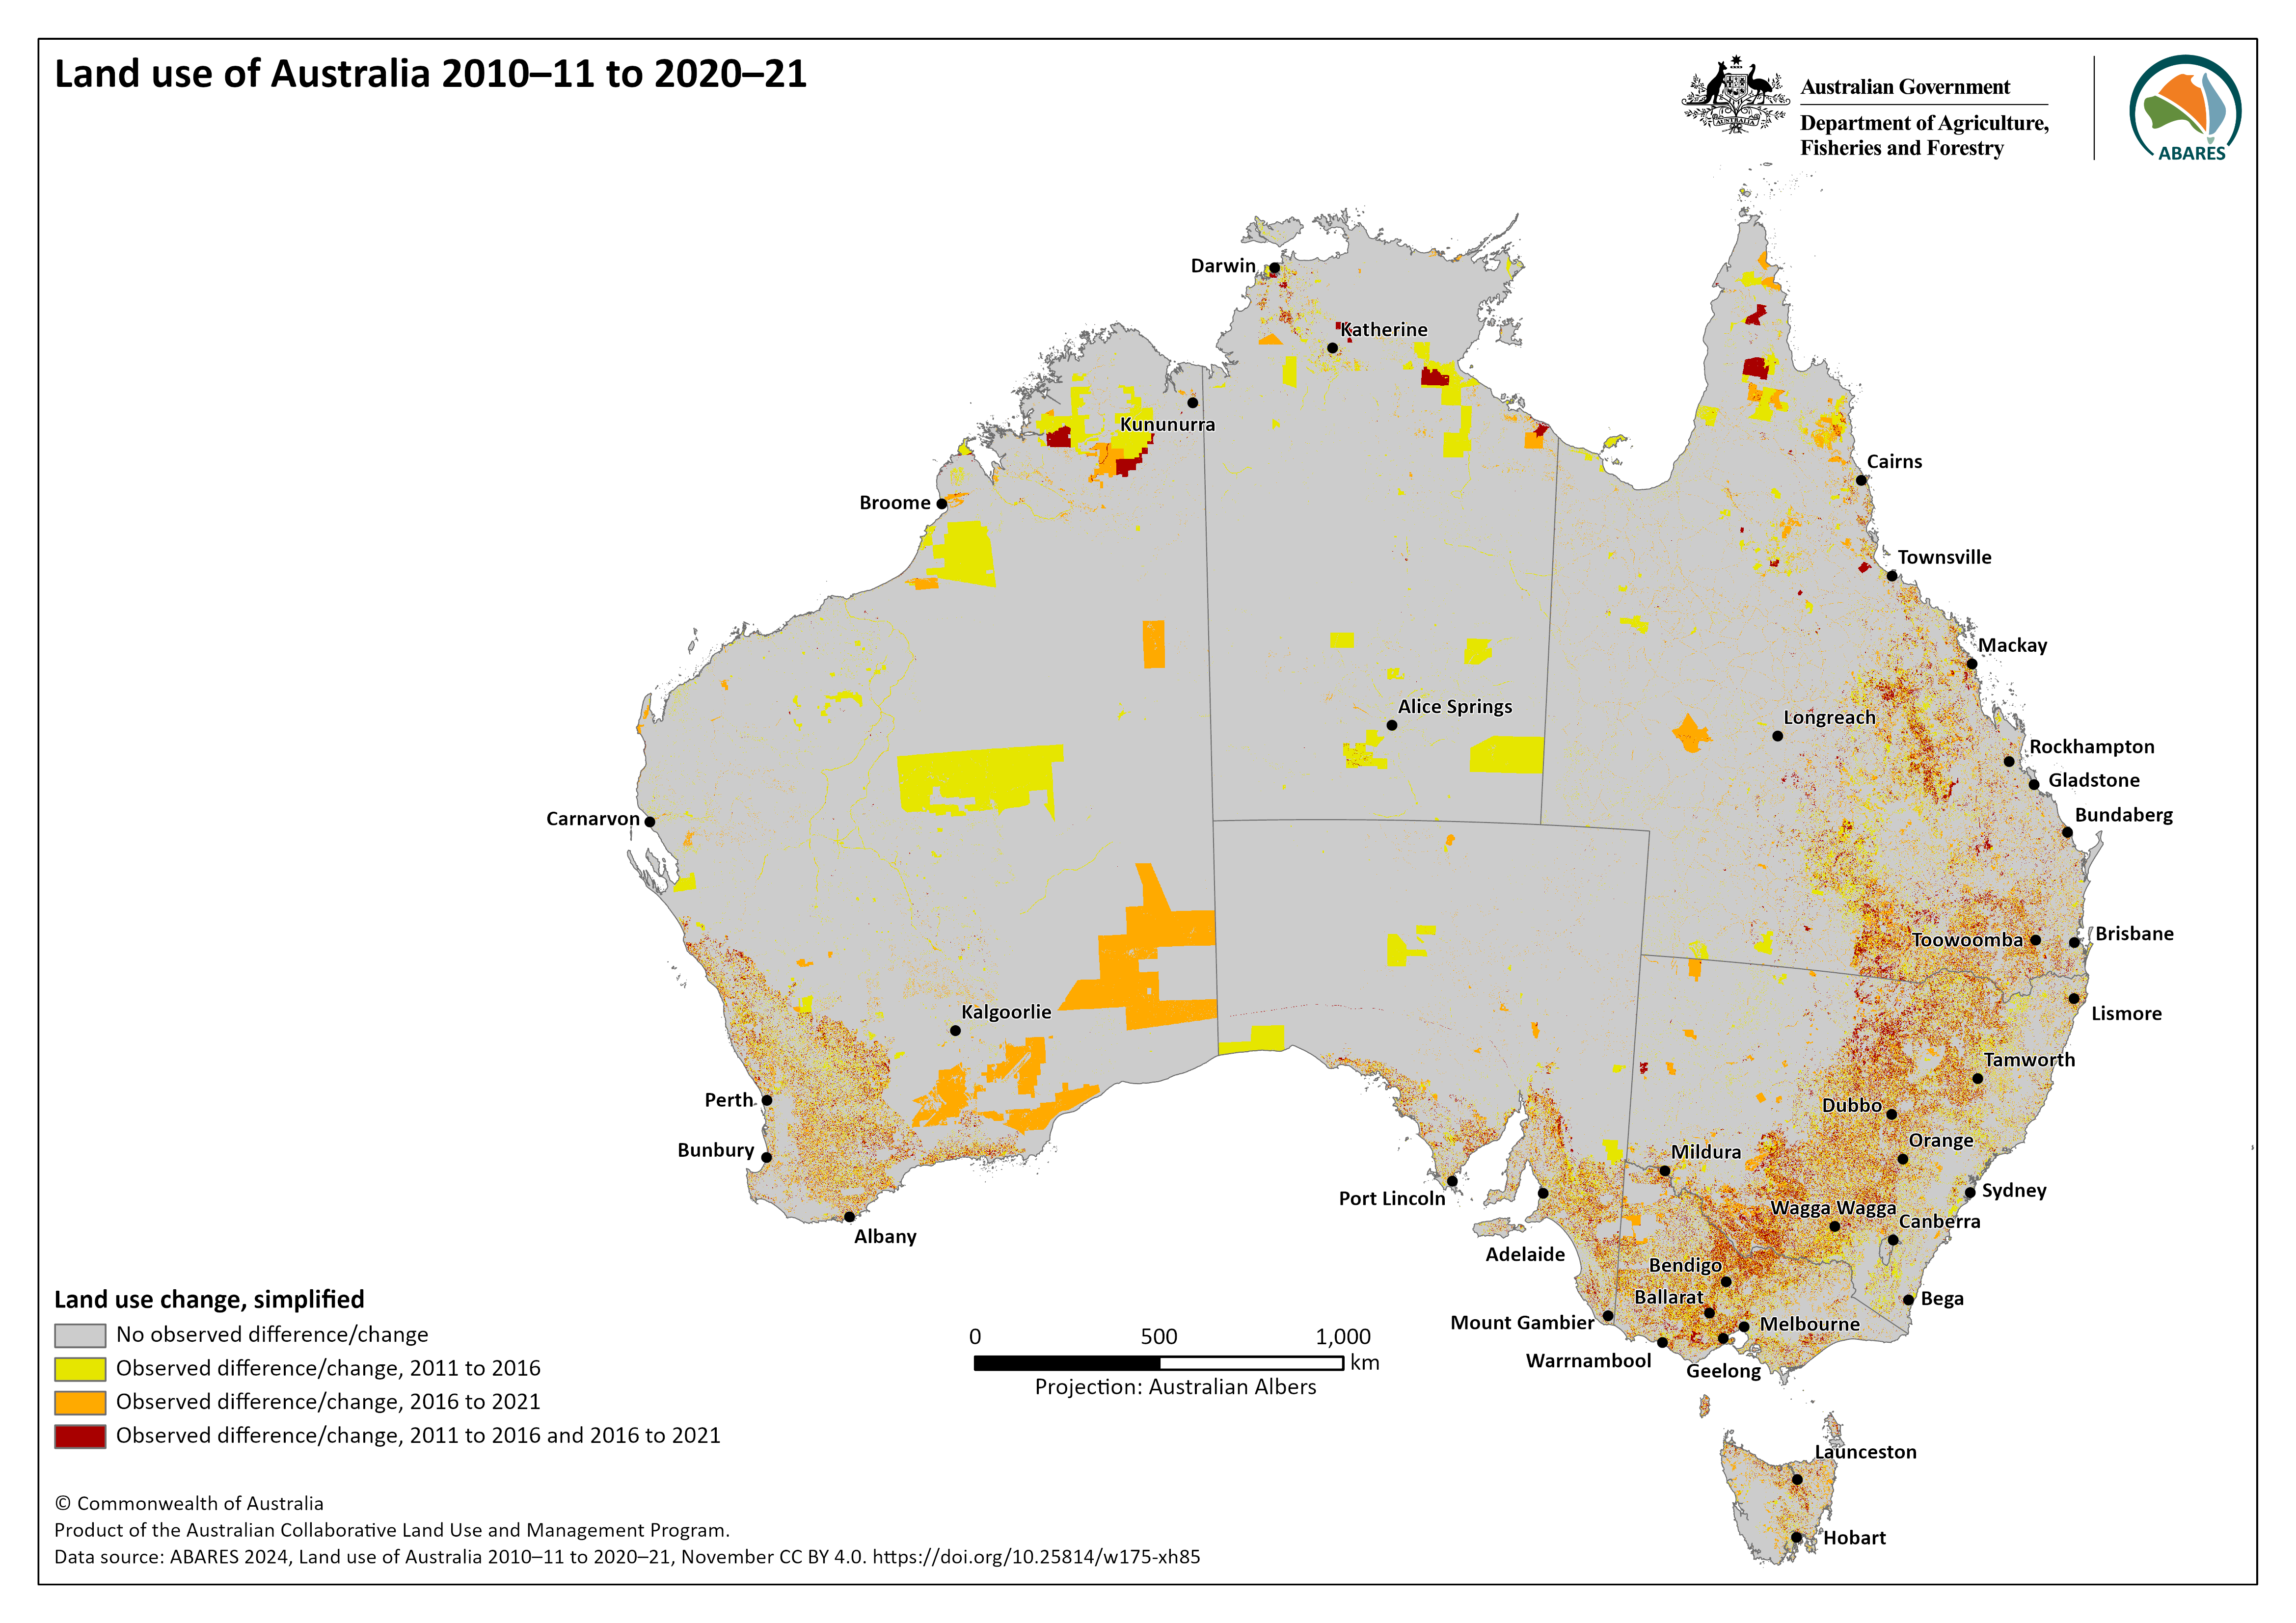
Map 2. Land use change between 2010–11, 2015–16 and 2020–21
Non-agricultural land uses are mapped using seven thematic layers, derived from existing datasets provided by states and territories, and external agencies. The seven layers are:
- protected areas
- topographic features
- land tenure
- forest cover
- catchment-scale land use
- urban boundaries, and
- stock routes.
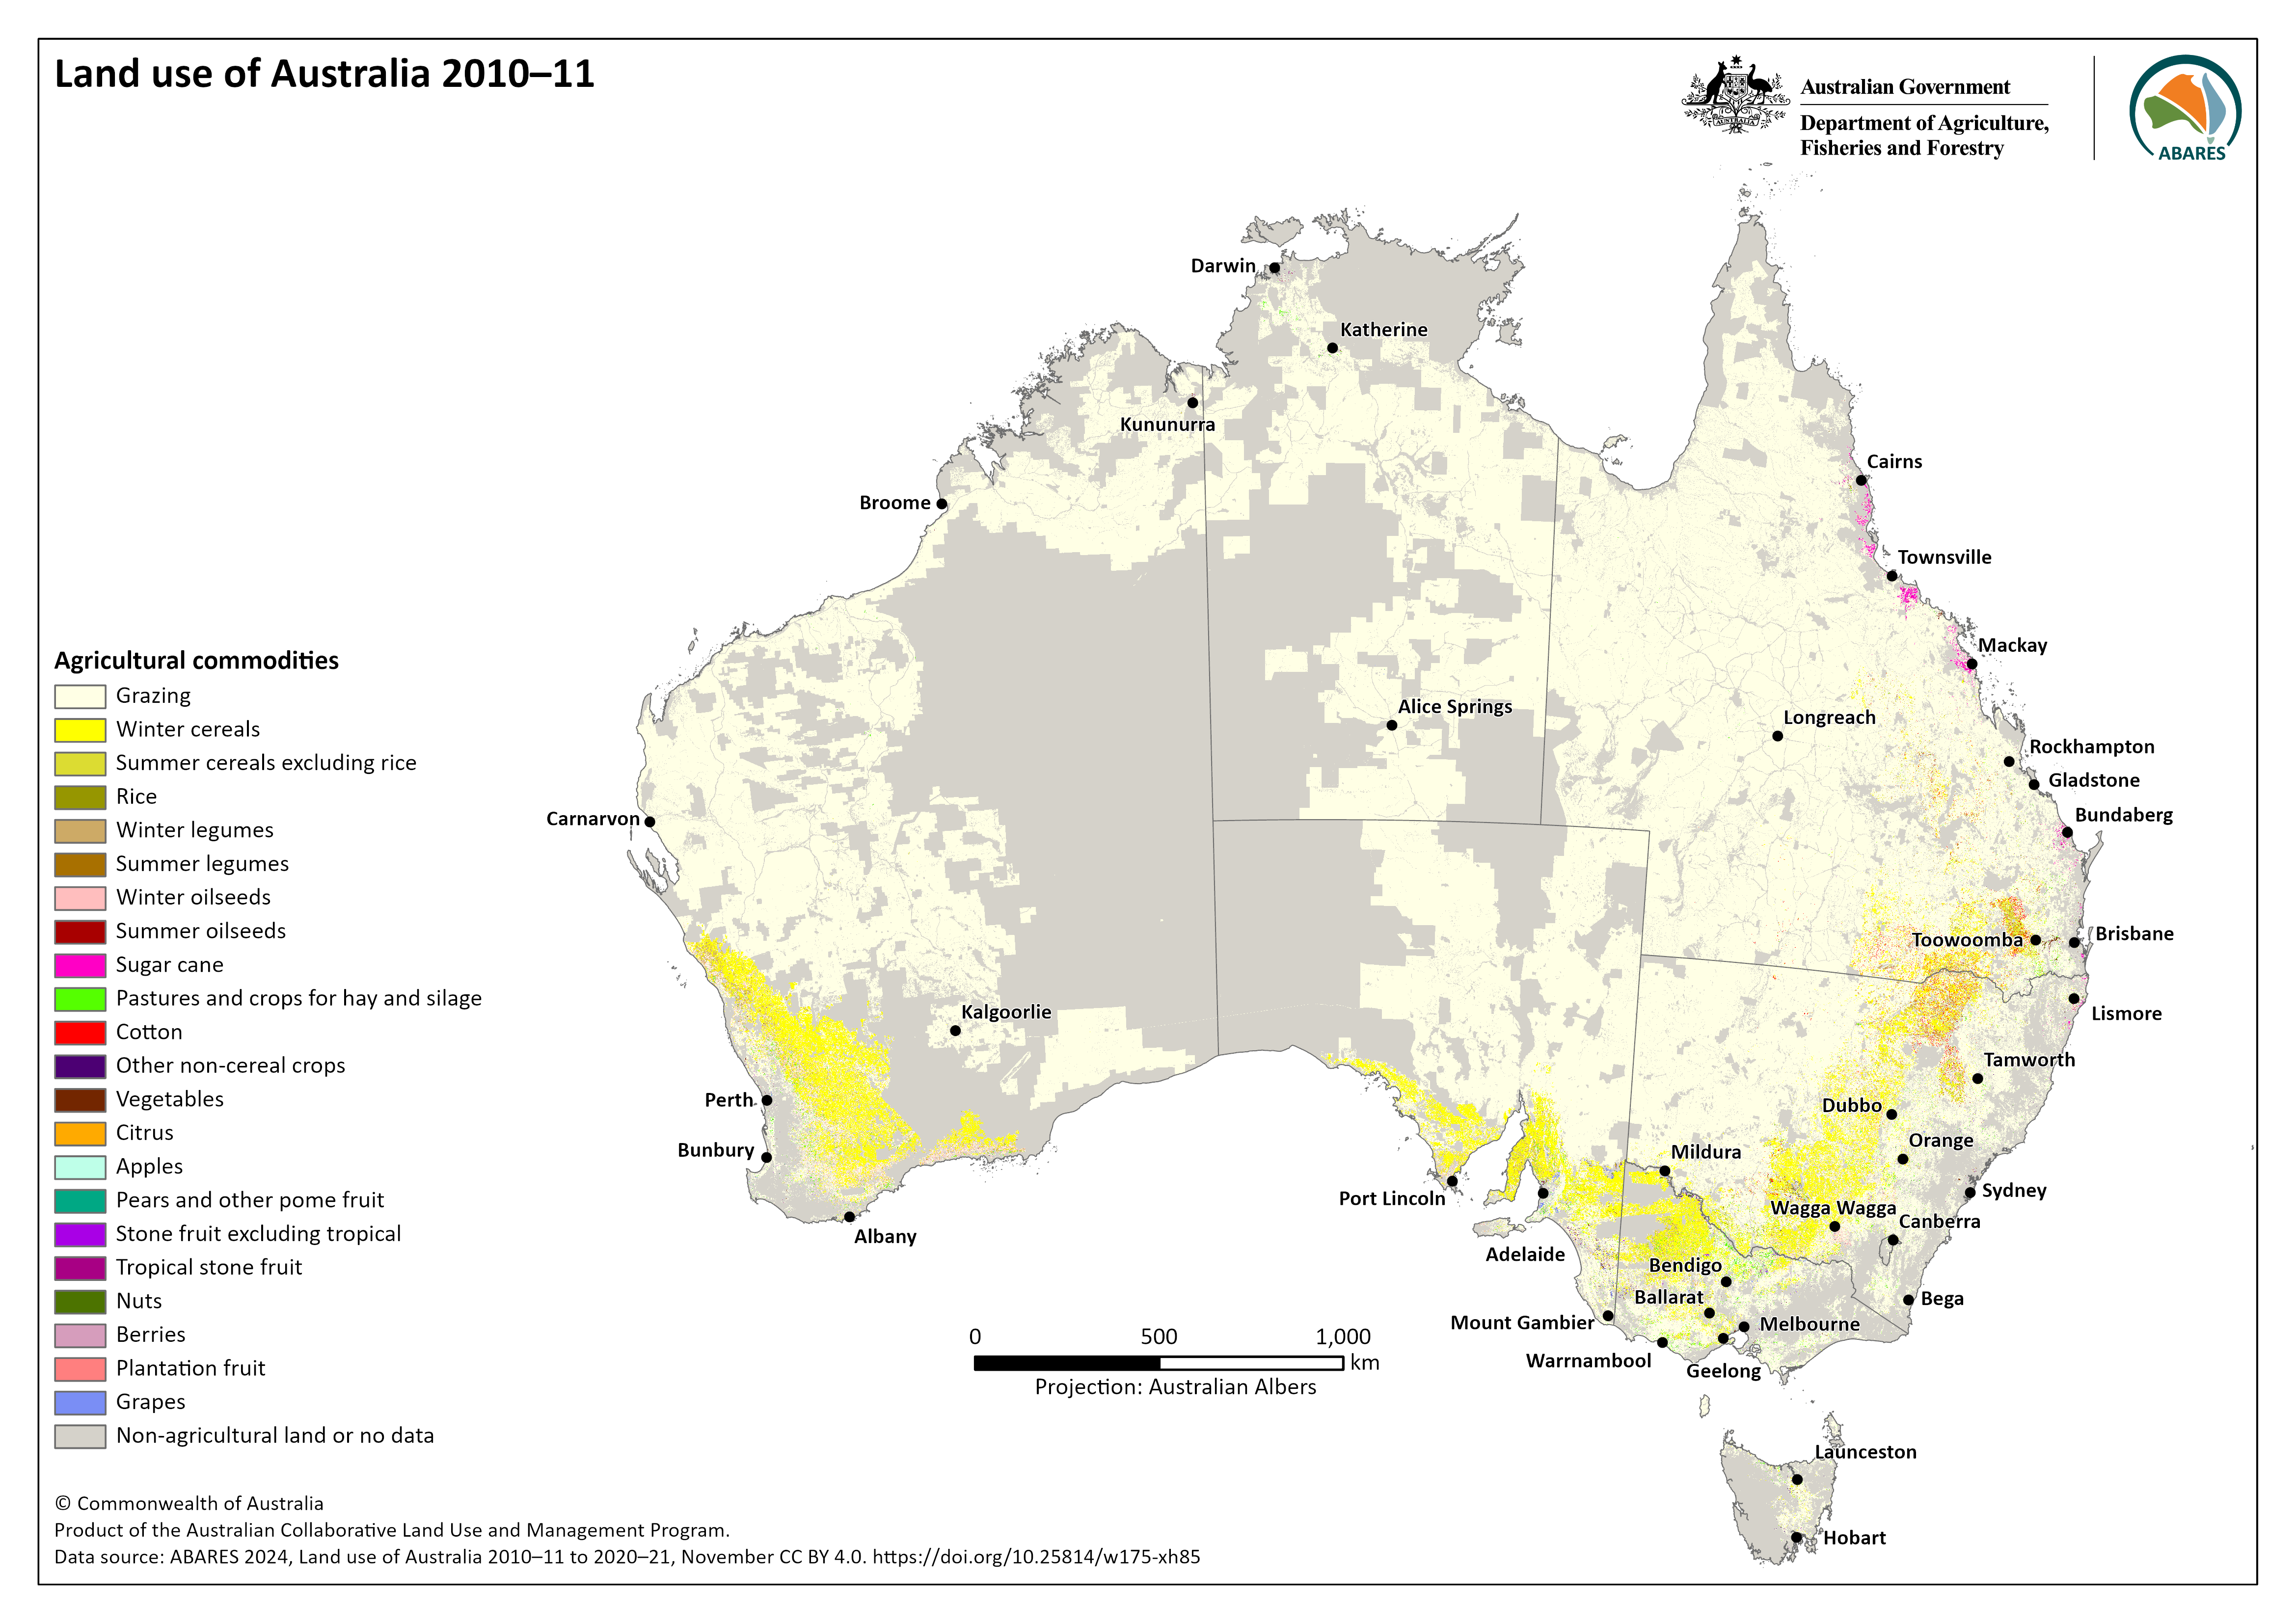
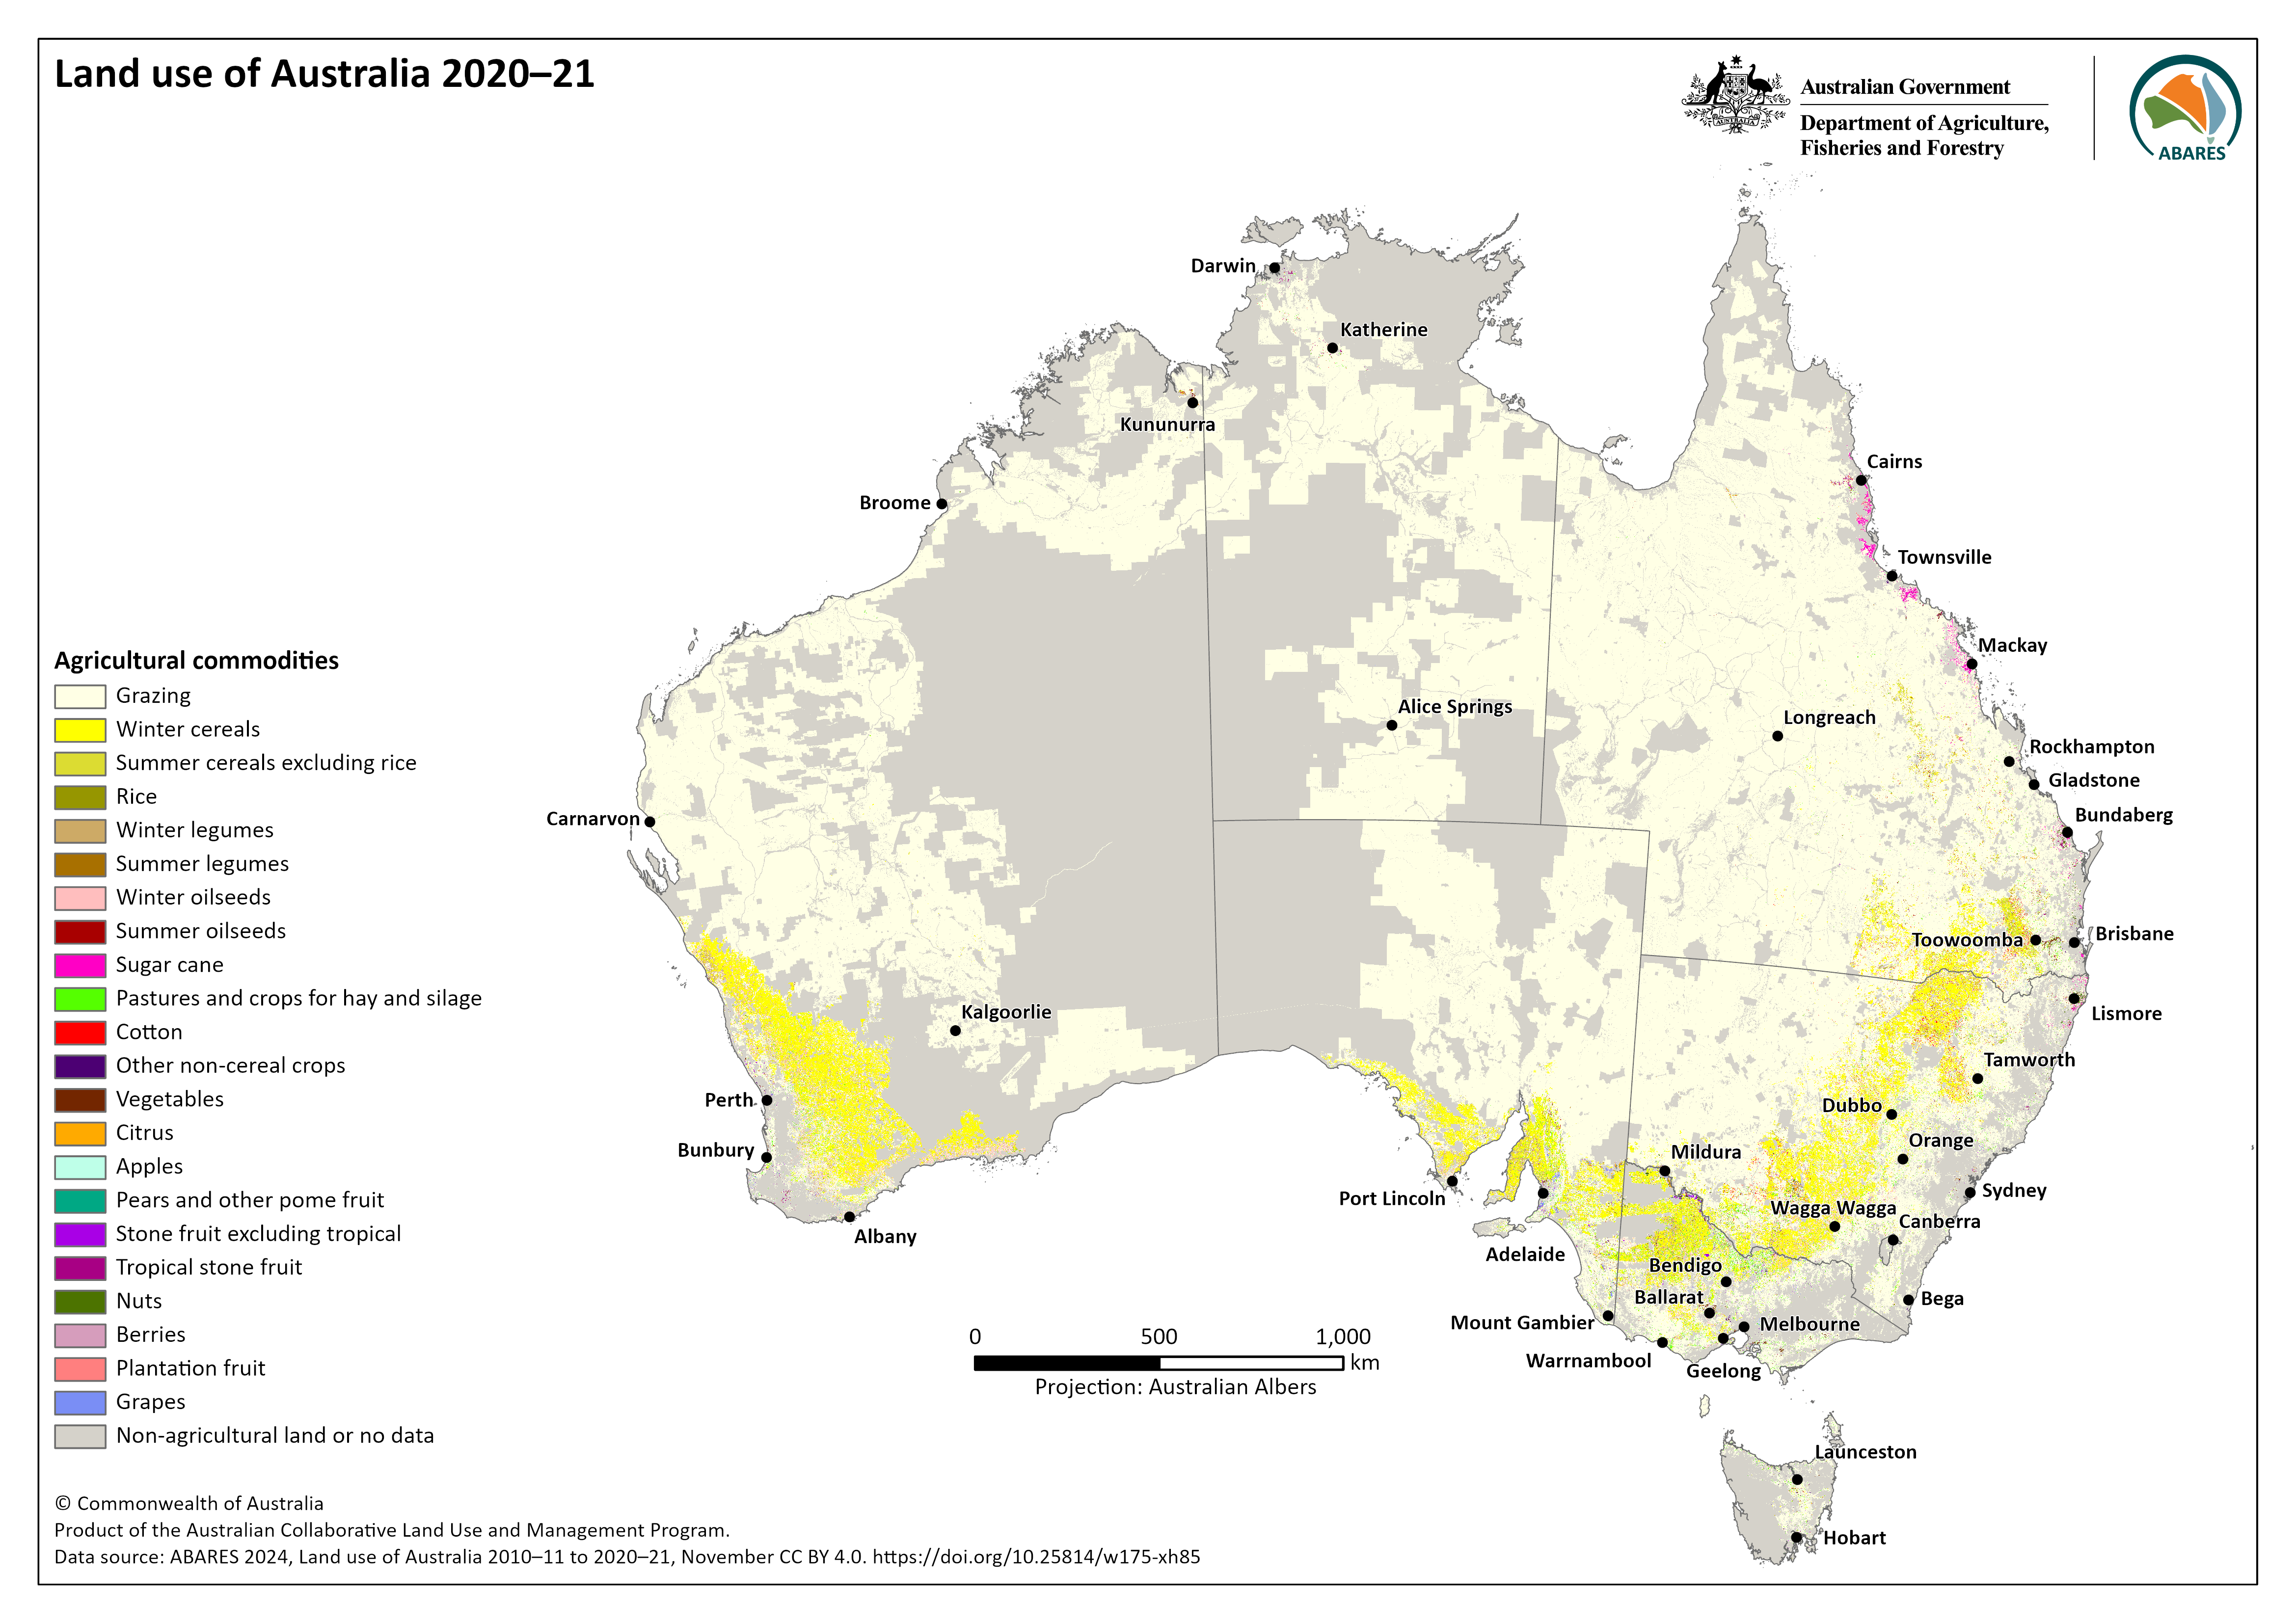
The agricultural land uses are based on the Australian Bureau of Statistics’ 2010–11, 2015–16, and 2020–21 agricultural census data; with spatial distributions modelled using Terra Moderate Resolution Imaging Spectroradiometer (MODIS) satellite imagery and training data, assisted by spatial constraint layers for cultivation, horticulture, and irrigation. For more detailed information see the metadata.
Use the Land use of Australia 2010–11 to 2020–21 for:
- National and regional land use statistics including land accounts and ecosystem accounts
- Land use change (2010-11, 2015-16, 2020-21)
- Broad land use classes, moderate resolution (250m x 250m)
See Land use data download for other products.
Data
Land use time periods
- Land use of Australia 2010–11 - raster package (GeoTIFF and supporting files) (ZIP 36.6 MB)
- Land use of Australia 2015–16 - raster package (GeoTIFF and supporting files) (ZIP 35.1 MB)
- Land use of Australia 2020–21 - raster package (GeoTIFF and supporting files) (ZIP 35 MB)
Land use and associated change for the three time periods
- Land use of Australia change 2010–11 to 2020–21 - raster package (GeoTIFF and supporting files) (ZIP 72.7 MB)
Thematic layers: non-agricultural land uses
- Land use of Australia 2010–11 thematic layers - raster package (GeoTIFF and supporting files) (ZIP 107.8 MB)
- Land use of Australia 2015–16 thematic layers - raster package (GeoTIFF and supporting files) (ZIP 106.8 MB)
- Land use of Australia 2020–21 thematic layers - raster package (GeoTIFF and supporting files) (ZIP 108.2 MB)
Agriculture commodities probability grids
- Land use of Australia 2010–11 agricultural commodities probability grids - raster package (GeoTIFF and supporting files) (ZIP 229 MB)
- Land use of Australia 2015–16 agricultural commodities probability grids - raster package (GeoTIFF and supporting files) (ZIP 234 MB)
- Land use of Australia 2020–21 agricultural commodities probability grids - raster package (GeoTIFF and supporting files) (ZIP 246 MB)
The Land use of Australia 2010–11 to 2020–21, 250 m data package is also available on data.gov.au.
Metadata
Land use of Australia 2010–11 to 2020–21 – Descriptive metadata (PDF 1.4 MB) or (Word 980 KB)
Maps
Maps are available in both PNG and PDF format.
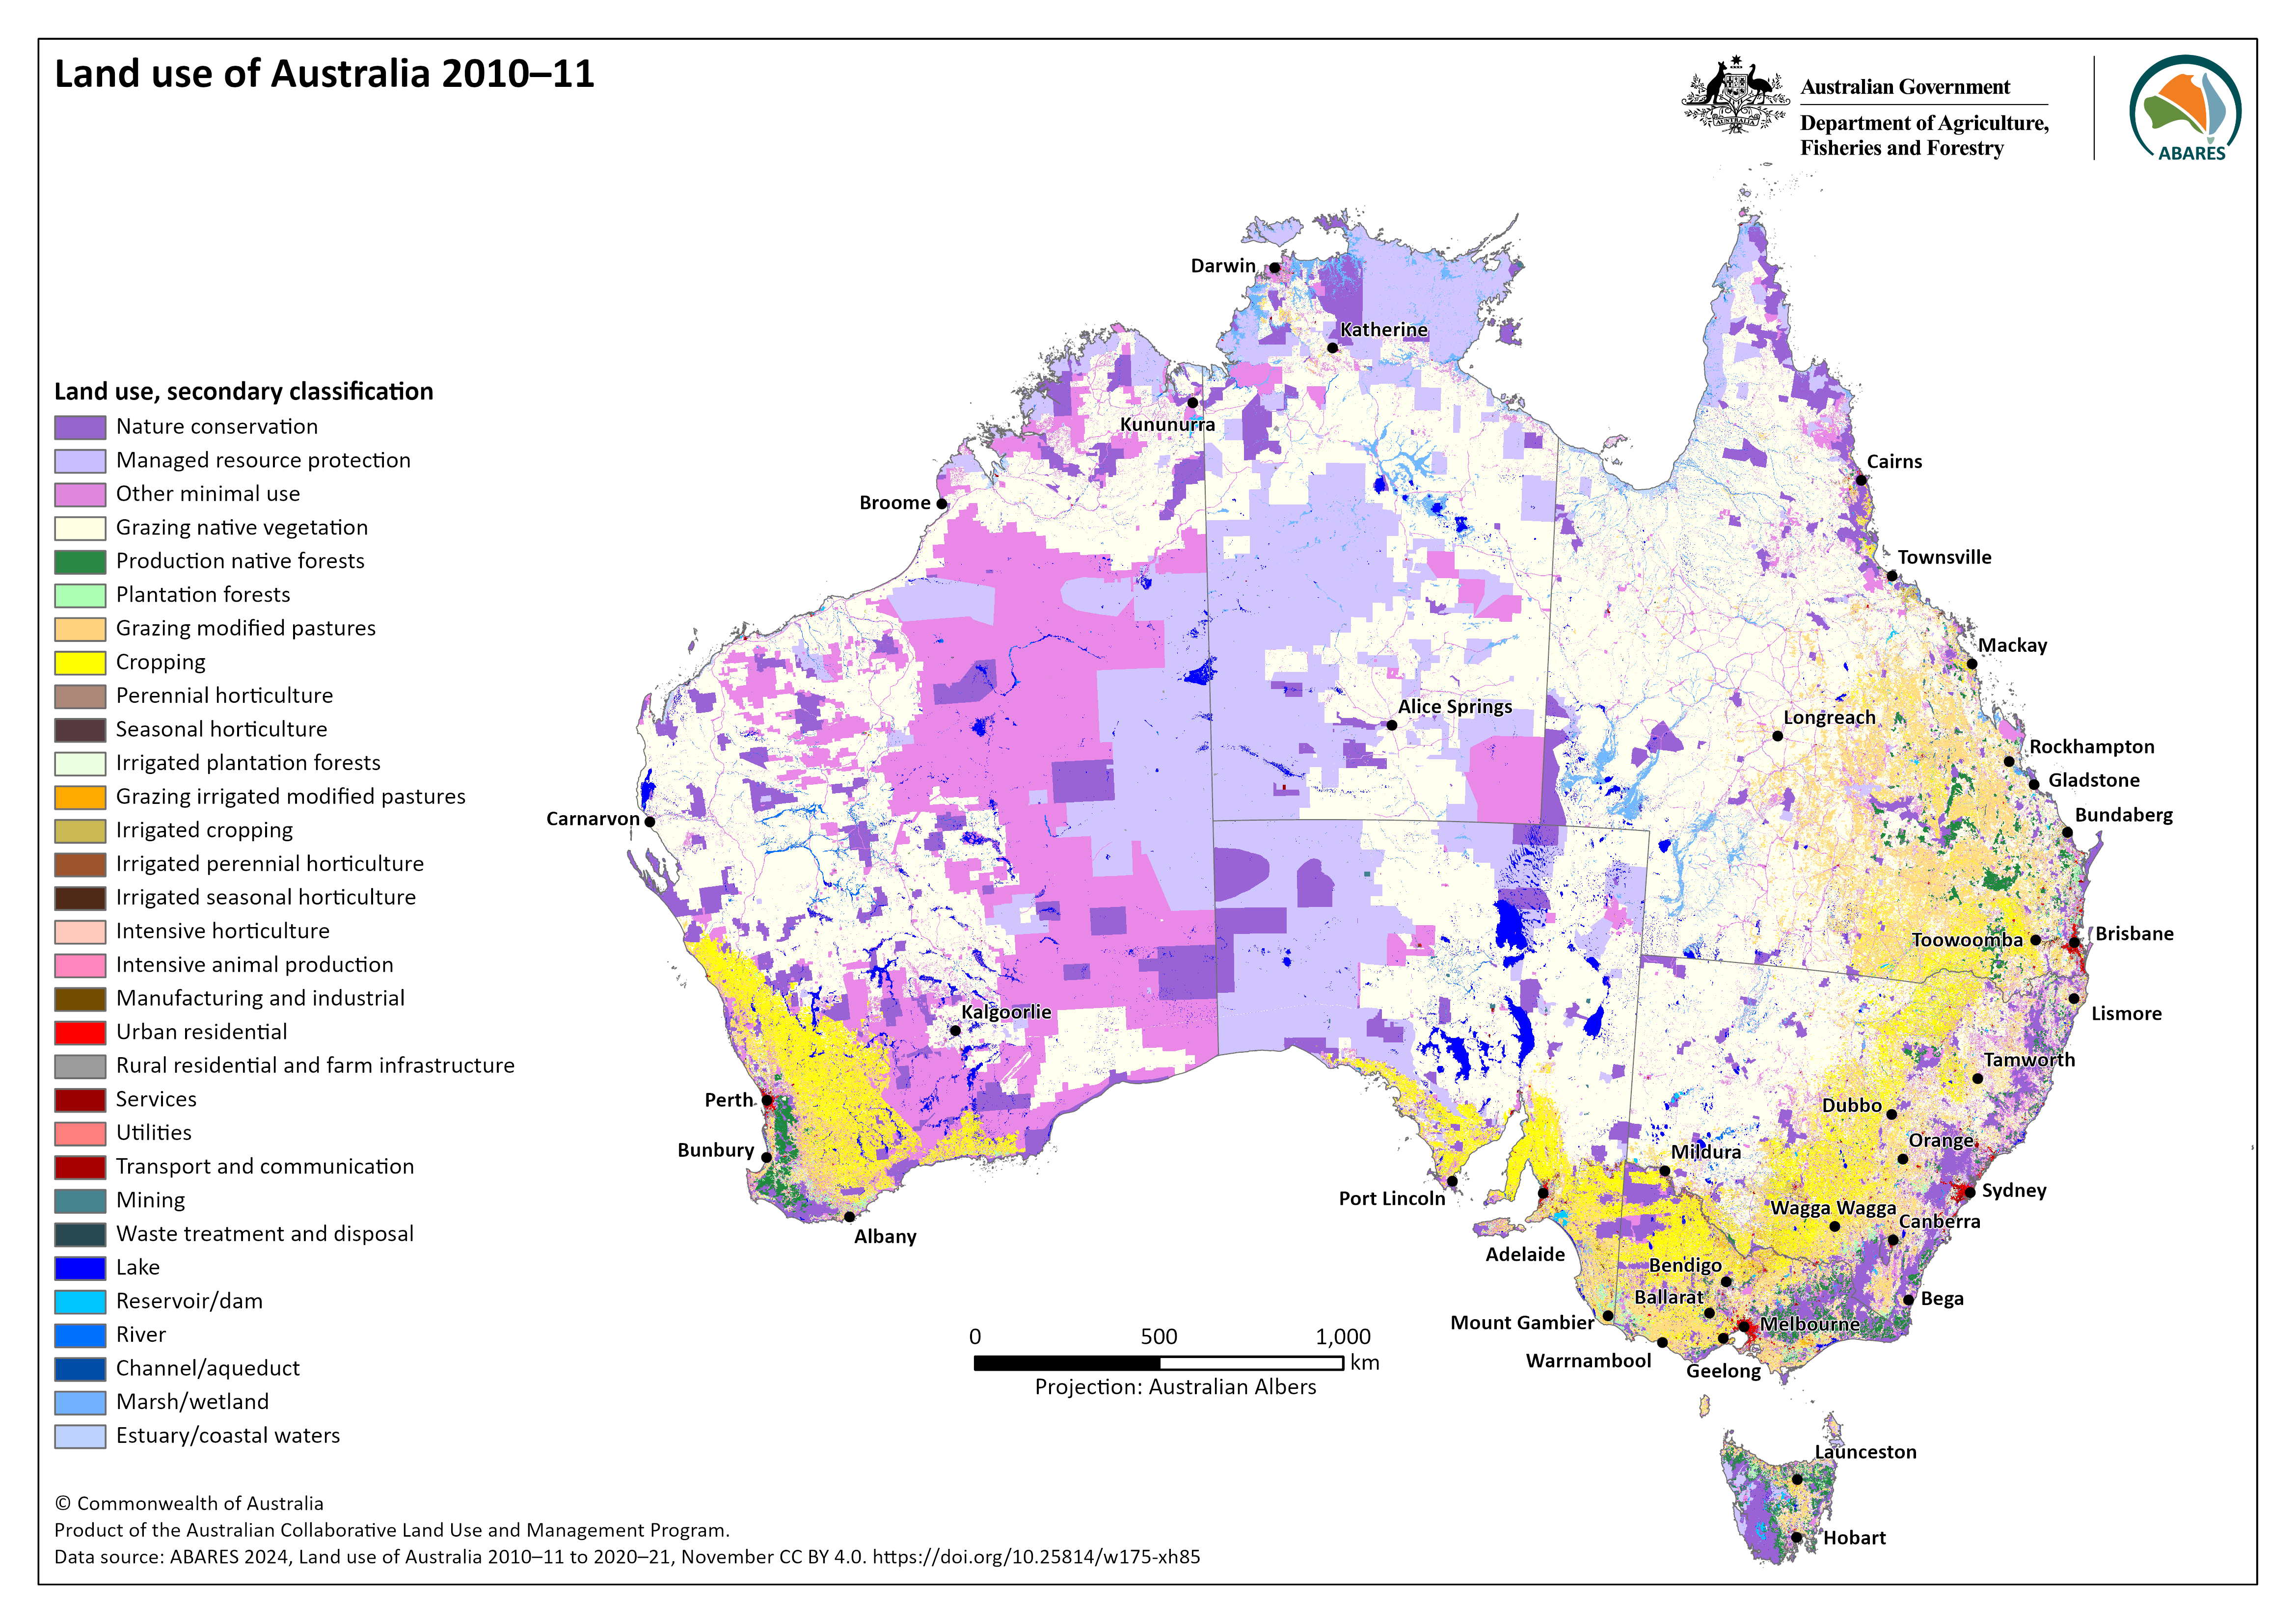
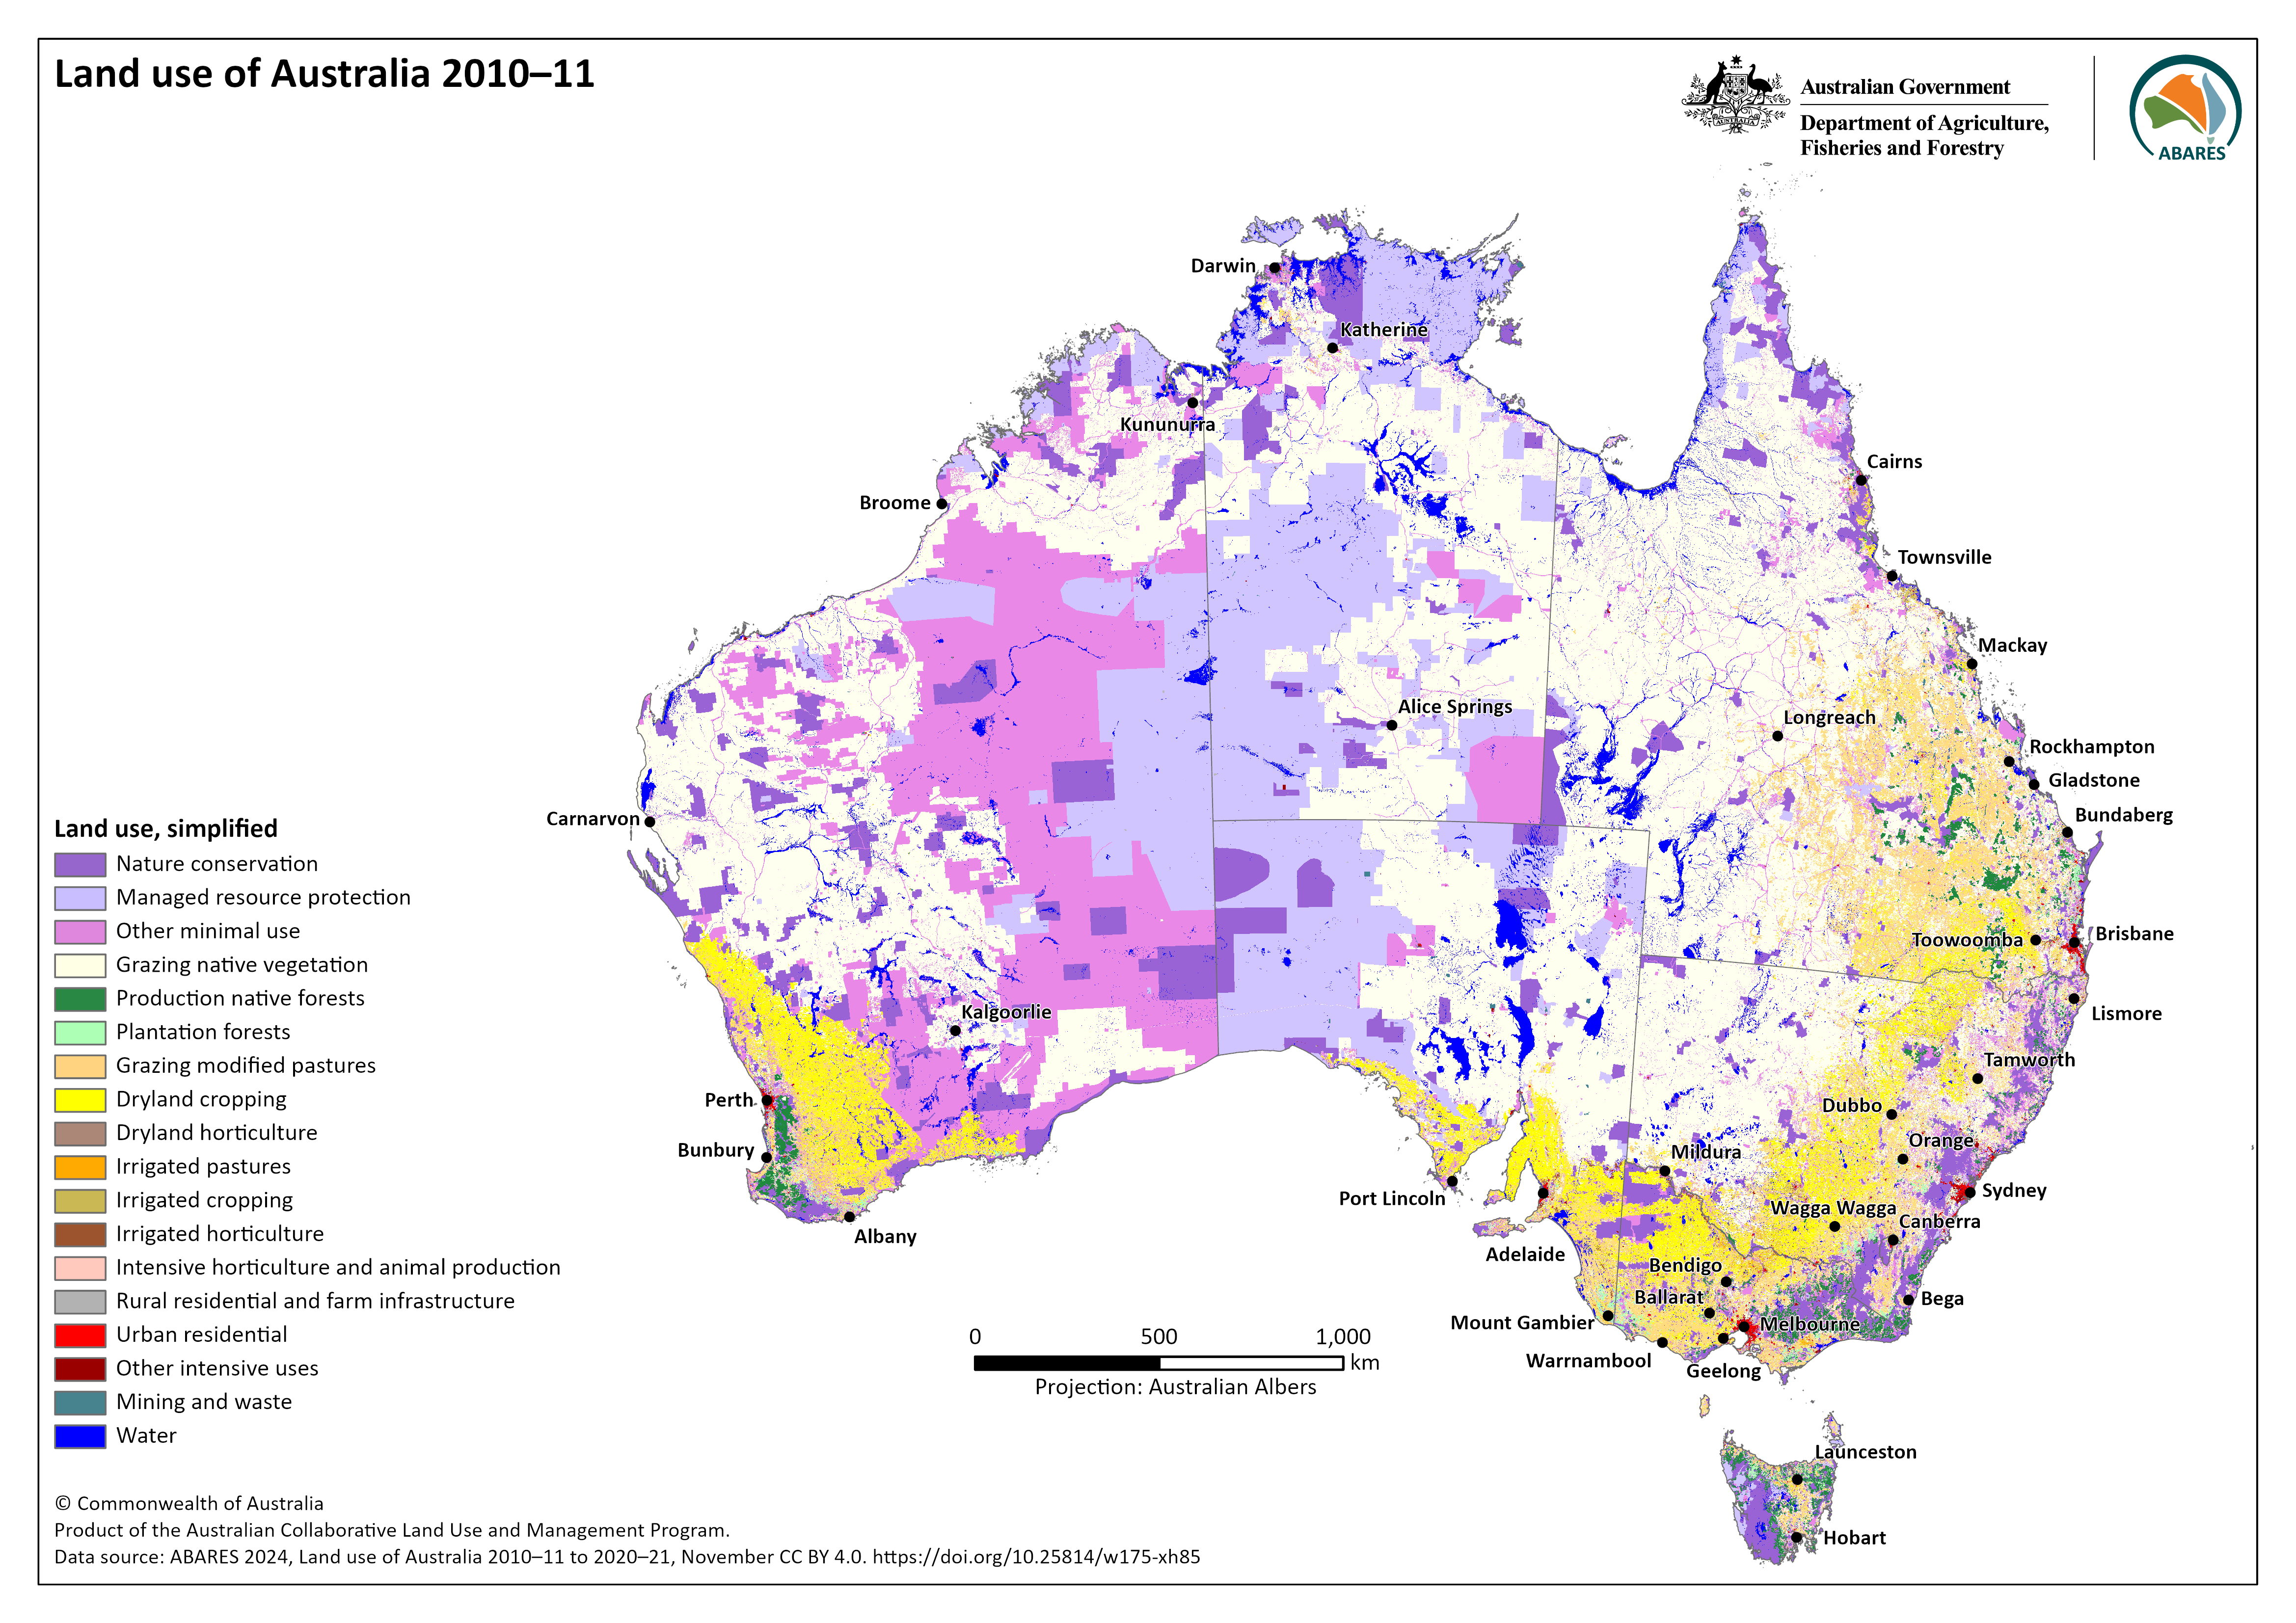
Land use of Australia 2010–11
- Land use based on ALUM secondary classification – PNG PDF
- Land use based on simplified classification – PNG PDF
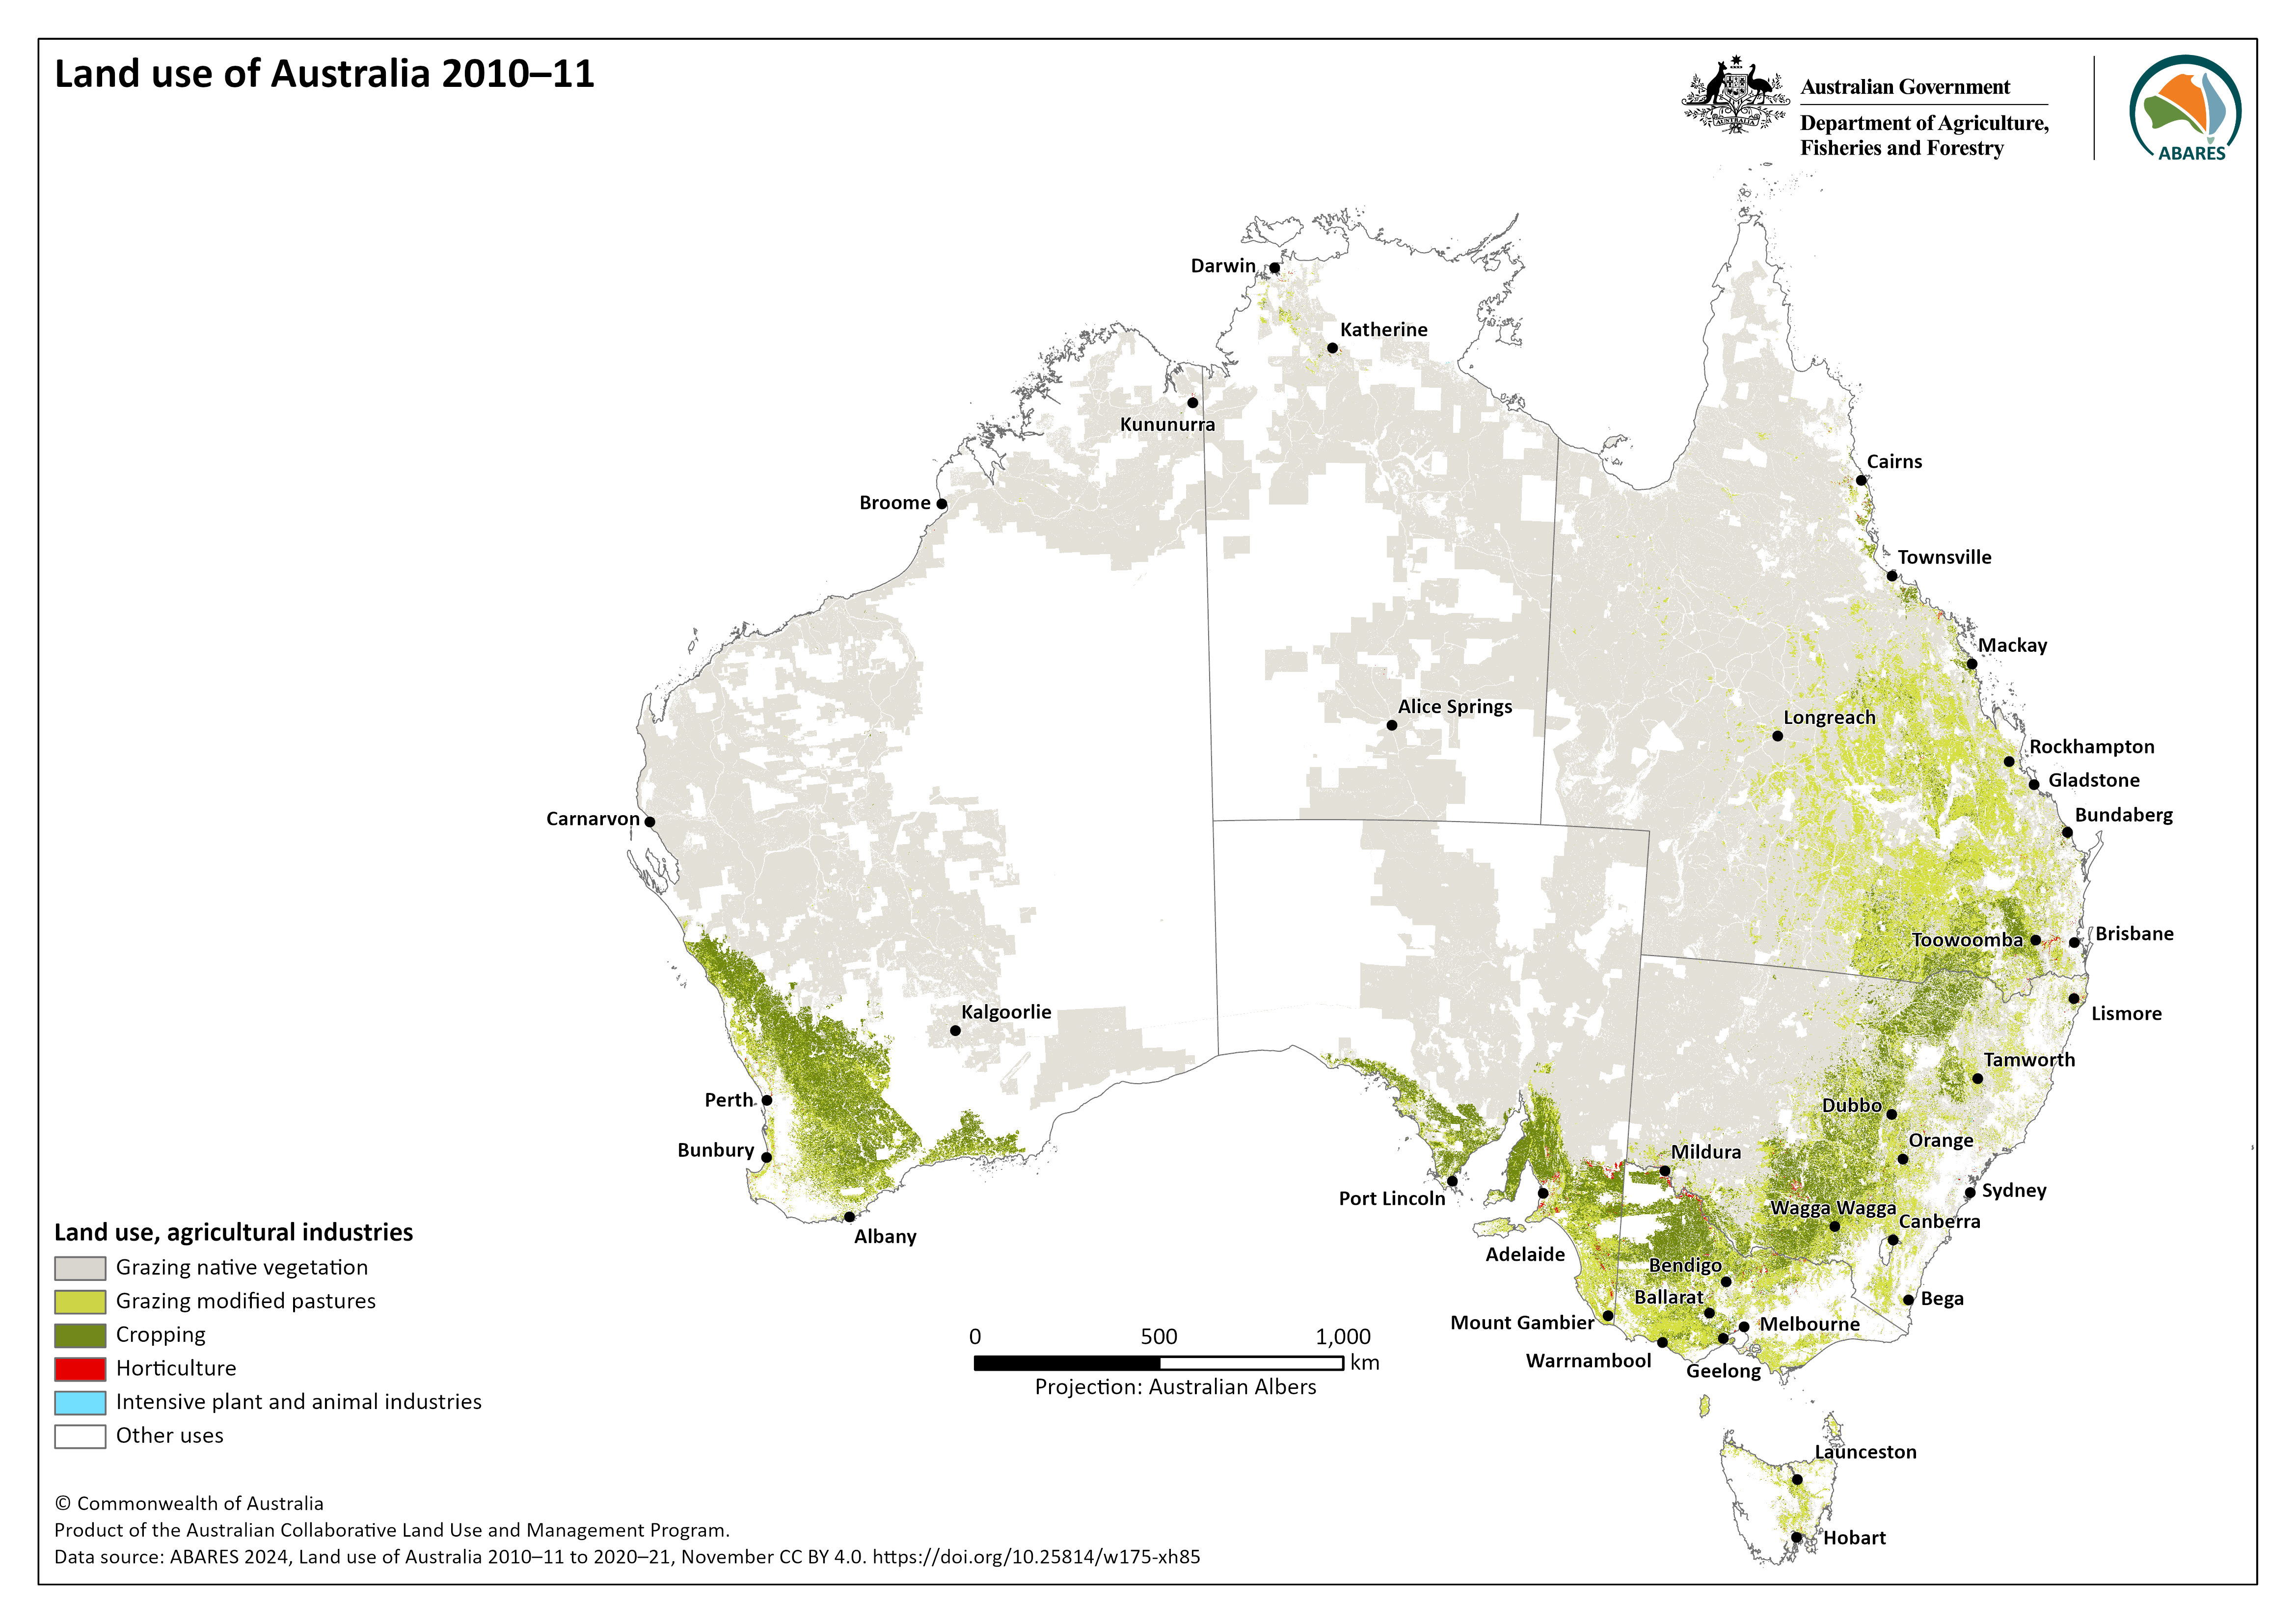
- Land use based on agricultural industries – PNG PDF
- Land use based on agricultural commodities – PNG PDF
Land use of Australia 2015–16
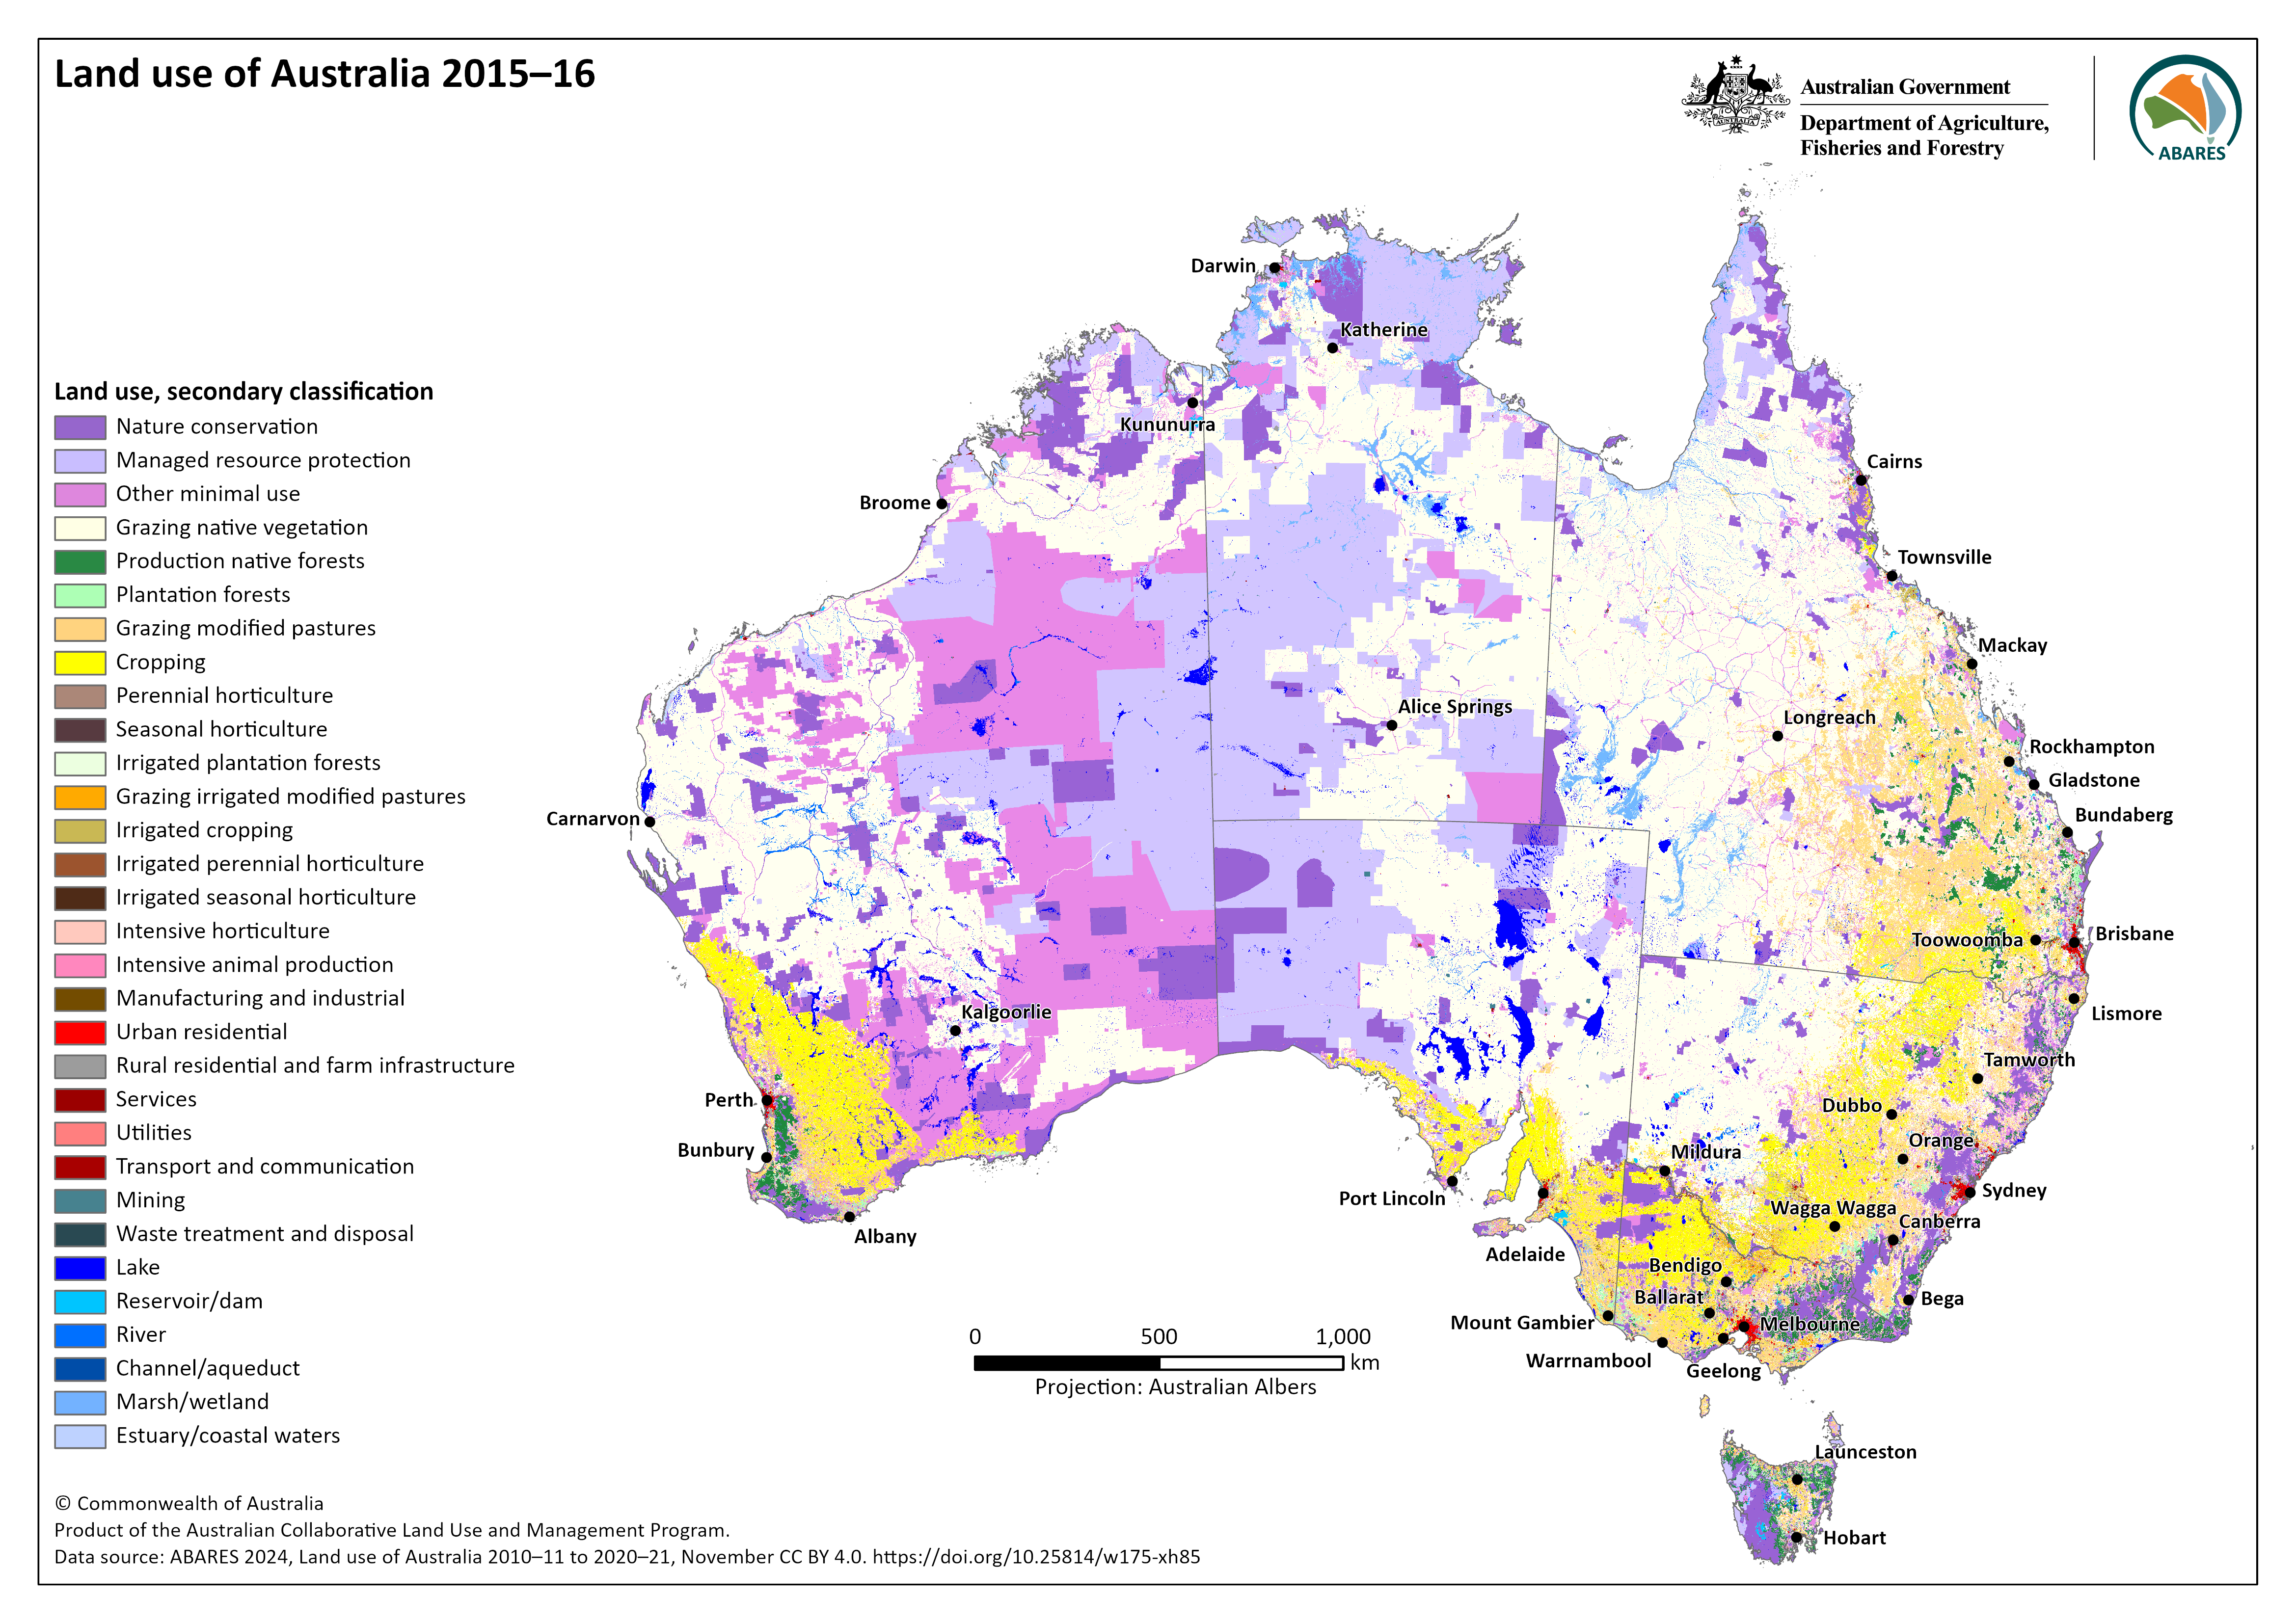
- Land use based on ALUM secondary classification – PNG PDF
- Land use based on simplified classification – PNG PDF
- Land use based on agricultural industries – PNG PDF
- Land use based on agricultural commodities – PNG PDF
Land use of Australia 2020–21
- Land use based on ALUM secondary classification – PNG PDF
- Land use based on simplified classification – PNG PDF
- Land use based on agricultural industries – PNG PDF
- Land use based on agricultural commodities – PNG PDF
Land use change
ABARES 2024, Land use of Australia 2010–11 to 2020–21, Australian Bureau of Agricultural and Resource Economics and Sciences, Canberra, October, CC BY 4.0. DOI: 10.25814/w175-xh85
Land use is classified according to the Australian Land Use and Management (ALUM) Classification Version 8, a three-tiered hierarchical structure. There are five primary classes, identified in order of increasing levels of intervention or potential impact on the natural landscape. Water is included separately as a sixth primary class. Primary and secondary levels relate to the principal land use. Tertiary classes may include additional information on commodity groups, specific commodities, land management practices, or vegetation information.
These data are a product of the Australian Collaborative Land Use and Management Program (ACLUMP). ACLUMP, a consortium of Australian, state and territory government partners, promotes the development of nationally consistent information on land use, land cover, and land management practices underpinned by common technical standards. See the metadata for more detailed acknowledgments for each dataset.
Analysis
The National Land Account, Experimental Estimates provide a physical account and change matrix for land use for Australia and for each state and territory. Some differences exist between the National Land Account due to their use of a previous version of the Land use of Australia. This will be aligned in the future.
Interactive views
Interactive views are not yet available.
Contact