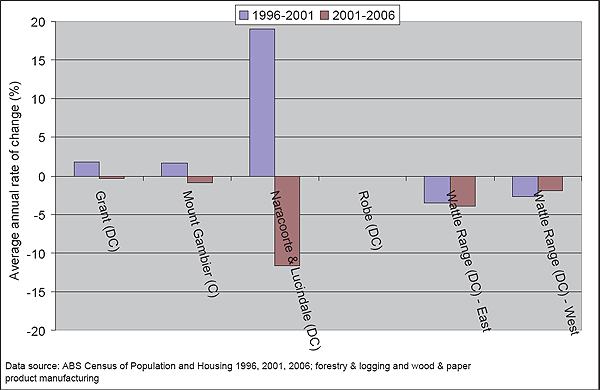
Figure A1.1: Rate of change in employment in South East SD, 1996, 2001, 200631

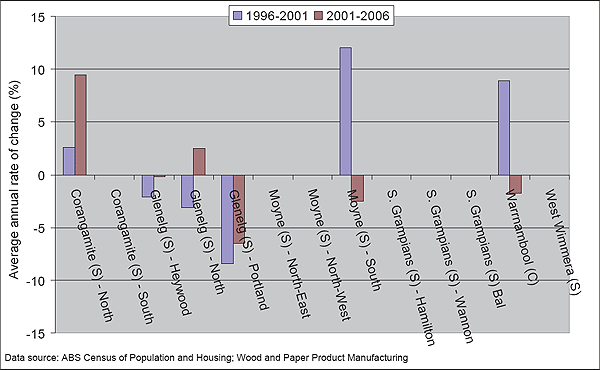
Figure A1.2: Rate of change in employment in Western District and Wimmera SDs, 1996, 2001, 2006

Figure A1.3: Rate of change in employment in forestry and logging sector – South Australia, 1996, 2001, 2006

Figure A1.4: Rate of change in employment in forestry and logging sector - Victoria, 1996, 2001, 2006

Figure A1.5: Rate of change in employment in the South Australian wood and paper product manufacturing sector, 1996, 2001, 2006

Figure A1.6: Rate of change in employment in the Victorian wood and paper product manufacturing sector, 1996, 2001, 2006
31 Note: Where an area had < 20 employees in all time periods rate of change is not shown, as randomisation of data by the ABS together with small numbers of people employed make the rate of change data potentially meaningless for areas with small numbers of forest industry workers.
