
Key issues
- In the week ending 20 February 2025, low-pressure systems brought rainfall to the north and east of Australia
- Tropical Cyclone Zelia brough rainfall totals exceeding 400 millimetres to coastal and inland areas of Western Australia
- Rainfall totals of between 0-50 millimetres were recorded across eastern cropping regions, with the highest rainfalls in northern Queensland. These falls are likely to be sufficient to support average soil moisture levels and above average summer crop yield potentials but may have delayed the harvest of earlier planted summer crops.
- In contrast, southern cropping regions received little to no rainfall.
- Over the coming eight days, rainfall totals are expected to be low.
- All cropping regions are expected to receive up to 10 millimetres of rainfall, with isolated areas expected to receive up to 15 millimetres.
- Globally, variable rainfall during January has led to mixed crop production prospects.
- Global production conditions were generally favourable for rice, maize and soybeans, but more variable for wheat.
- Global production conditions have been less favourable compared to those used to formulate ABARES forecasts of global grain supplies and world prices for 2024–25 in its December 2024 edition of the Agricultural Commodities Report. As a result, global grain and oilseed production are likely to decline slightly compared to those presented in the December forecast.
- Water storage levels in the Murray-Darling Basin (MDB) decreased between 13 February 2025 and 20 February 2025 by 231 gigalitres (GL). Current volume of water held in storage is 13 661 GL, equivalent to 61% of total storage capacity. This is 25 percent or 4,646GL less than at the same time last year. Water storage data is sourced from the Bureau of Meteorology.
- Allocation prices in the Victorian Murray below the Barmah Choke increased from $190 on 13 February to $162on 20 February. Prices are lower in regions above the Barmah choke (except Murrumbidgee) due to the binding of the Barmah choke trade constraint.
Climate
In the week ending 19 February, Tropical Cyclone (TC) Zelia brought rainfall to the west of the country. In the north and east, low-pressure systems contributed to showers and storms. High-pressure systems kept the remainder of the country largely dry.
- The northern tropics, including the Northern Territory, and northern Western Australia and Queensland recorded falls between 10-200 millimetres, with rainfall totals higher in far-northern regions.
- In west Western Australia, TC Zelia brought rainfall totals exceeding 400 millimetres to coastal areas, with inland regions seeing between 10-300 millimetres.
- Eastern Queensland and New South Wales received between 5–100 millimetres of rainfall. Tasmania and eastern Victoria received between 10-50 millimetres. Much of the remainder of country recorded little to no rainfall over the period.
Rainfall totals were generally low across cropping regions in the south:
- In the east, much of Queensland and New South Wales saw between 5-50 millimetres of rainfall, with isolated areas of Queensland recording up to 100 millimetres.
- These falls have likely boosted soil moisture for late panted summer crops and ahead of the planting of winter crops, however, this will also likely have brought some delays to the harvesting of earlier planted summer crops.
- In contrast, southern cropping regions including Western Australia, South Australia, and Victoria received little to no rainfall.
Rainfall for the week ending 19 February 2025
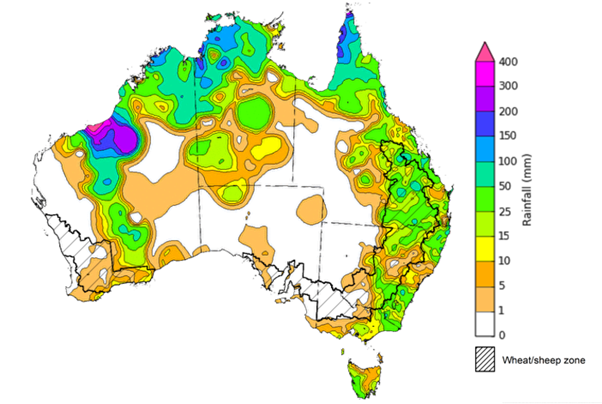
Issued: 19/2/2025
Note: The rainfall analyses and associated maps utilise data contained in the Bureau of Meteorology climate database, the Australian Data Archive for Meteorology (ADAM). The analyses are initially produced automatically from real-time data with limited quality control. They are intended to provide a general overview of rainfall across Australia as quickly as possible after the observations are received. For further information go to http://www.bom.gov.au/climate/rainfall/
Over the 8 days to 27 February 2025, low-pressure systems are expected to bring rainfall to parts of the north and east of the country:
- Falls of between 10–50 millimetres are likely for parts of northern Western Australia, the Northern Territory and northern Queensland.
- Isolated areas in the far north are forecast to receive up to 100 millimetres of rainfall.
- Between 10–50 millimetres are forecast for the far east of Queensland, northeastern New South Wales and much of Tasmania.
- By contrast, a high-pressure system is expected to keep much of the remainder of Australia largely dry.
Rainfall totals across cropping regions over the coming week are forecast to be low:
- Low rainfall totals (1-10 millimetres) are forecast for all cropping regions, with the exceptions of southern Western Australia and northern Queensland (up to 15 millimetres of rainfall)
- While this is likely to contribute to a drawdown of soil moisture to support the growth of later sown summer crops, it will allow of an uninterrupted harvest of earlier sown crops.
Total forecast rainfall for the period 20 February to 27 February 2025
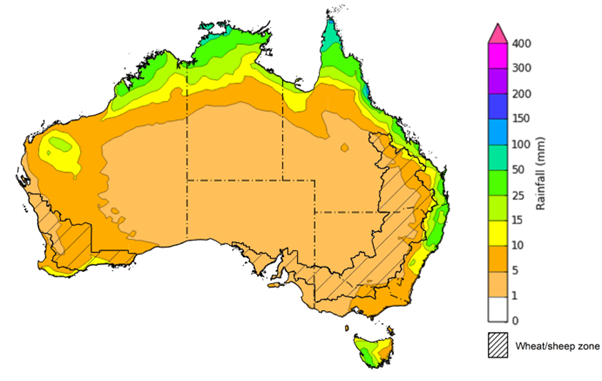
Issued 20/2/2025
Note: This rainfall forecast is produced from computer models. As the model outputs are not altered by weather forecasters, it is important to check local forecasts and warnings issued by the Bureau of Meteorology.
Crop production is affected by long-term trends in average rainfall and temperature, interannual climate variability, shocks during specific growth stages, and extreme weather events. Some crops are more tolerant than others to certain types of stresses, and at each growth stage, different types of stresses affect crop species in different ways.
Precipitation anomalies and outlooks presented below indicate the current and expected future production conditions for major grain and oilseed producing countries (responsible for over 80% of global crop production). This is an important input to assessing the global grain supply outlook.
Rainfall in January 2025 was variable across the world’s major grain- and oilseed-producing regions:
- In the southern hemisphere, precipitation was below average in southern Brazil, Argentina, and central Australia. Above average precipitation occurred in parts of southeast Asia.
- In the northern hemisphere, precipitation was below average in north, east and west of the United States, eastern India and China, and parts of the Black Sea region. Precipitation was above average in western Europe, southern India, and much of the north of the Russian Federation.
Global precipitation percentiles, January 2025
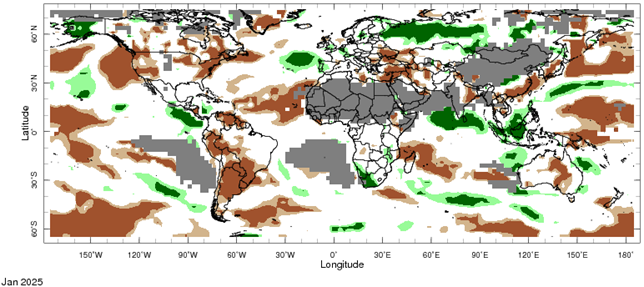
Source: International Research Institute for Climate and Society
As of 28 January 2025, global production conditions were generally favourable for rice, maize and soybeans, but variable for wheat:
- Wheat – in the northern hemisphere, winter wheat is developing under favourable climatic conditions, with exceptions of the Russian Federation, Ukraine and parts of the European Union.
- Maize – Harvest in Brazil is progressing favourably, but dry conditions in Argentina have adversely affected crop yields.
- Rice – Conditions are generally favourable, however, adverse climate conditions have negatively impacted crops in Vietnam.
- Soybeans – Harvest in the southern hemisphere is progressing under favourable conditions, with exceptions in drought affected areas in Argentina.
Crop conditions, AMIS countries, 28 January 2025
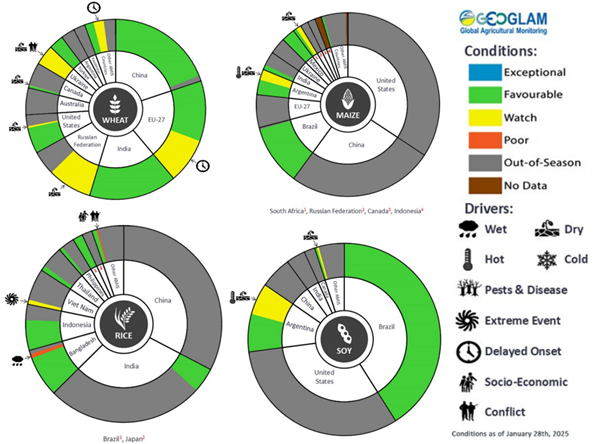
Source: AMIS
The global climate outlook for March 2025 to May 2025 indicates that mixed rainfall conditions are expected for the world’s major grain-producing and oilseed-producing regions. Outlooks and potential production impacts for the major grain and oilseed producing countries are presented in the following table.
Rainfall outlook and potential impact on the future state of production conditions, March-May 2025
| Region | March-May rainfall outlook | Potential impact on production |
|---|---|---|
| Argentina | Average to above average rainfall is more likely across northern parts of Argentina, with much of eastern and southern Argentina likely to see below average rainfall. | Above average rainfall is likely to support the filling and maturing of sorghum, rice, millet, soybeans and corn over this period. Whereas below average rainfall will likely adversely affect similar crop in the south and east. |
| Black Sea Region | Below average to average rainfall is expected across much of the Black Sea region, including parts of Türkiye, Ukraine, and the west of the Russian Federation. | Below average rainfall is likely impact the heading and grain development of wheat and canola in Ukraine, Türkiye, and the Russian Federation. |
| Brazil | Average rainfall is likely for much of Brazil, with exceptions in the far south. | Average rainfall in central and northern Brazil is likely to support the flowering of cotton, and the silking of corn, over the period. However, in the south, below average rainfall may reduce yield potential. |
| Canada | Generally, average to above average rainfall is likely across the south, with exceptions in some central regions. | Above average rainfall is likely to support the heading of wheat over the period, but may interfere with the planting of spring and summer crops in affected areas. |
| China | Below average rainfall is likely across parts of China, especially in eastern regions. Above average rainfall is more likely in the north and south. | Drier than average conditions in eastern regions may impact the heading of canola, wheat, and rice. |
| Europe | Average rainfall is likely for much of Europe, while parts of southern Europe (such as Italy and Spain) are likely to see above average rainfall. Below average rainfall is more likely in the north | Above average rainfall in the south is likely to support the heading of wheat in March and April, but below average rainfall may impact the heading of winter wheat and canola in northern regions in May. |
| South Asia (India) | Above average rainfall is expected in the south. Average rainfall is likely across remaining areas. | Average or better rainfall across much of India will support the maturing and harvest of wheat and canola. |
| Southeast Asia (SEA) | Average to above average rainfall is likely across much of Thailand, Vietnam, and Cambodia, as well as Indonesia and Malaysia, with average rainfall expected in the remaining regions. | Average to above average rainfall in SEA may impede the planting of corn and rice crops in the region. |
| The United States of America (US) | Generally, below average rainfall is likely for much of southern US, with above average rainfall more likely across the northeast and northwest. | Above average rainfall conditions expected across the northern US is like to support the heading of winter wheat, and provide moisture for the planting of corn and soybeans in May. |
Water
Water storages, water markets and water allocations - current week
The Tableau dashboard may not meet accessibility requirements. For information about the contents of these dashboards contact ABARES.

Commodities
Information on weekly price changes in agricultural commodities is now available at the Weekly commodity price update.