Source: ABARES
The PowerBI dashboard may not meet accessibility requirements. For information about the contents of these dashboards contact ABARES.
Authors: Tim Westwood, John Walsh and Mihir Gupta
Summary
This report provides a summary of water market conditions in 2020–21 and ABARES outlook for water allocation prices in the southern Murray-Darling Basin (sMDB) for 2021–22, under four representative scenarios: extreme dry, dry, average and wet. These scenarios are indicative and should not be treated as projections. Each scenario is modelled using the ABARES Water Trade Model and includes the latest data from state water agencies and updated seasonal conditions from the BOM. Seasonal conditions vary across the four outlook scenarios, as described in 2021 22 water market scenarios and Appendix A.
The La Niña event in 2020 put significant downward pressure on prices
Favourable weather conditions across Australia have led to significant improvements in water availability. These conditions were driven by a La Niña cycle and a negative Indian Ocean Dipole (IOD), both of which are associated with above average winter and spring rainfall in south eastern Australia (BOM 2020). As a result, inflows improved throughout 2020–21 and the volume of water in storages in the sMDB was 72% higher in February 2021, than the same time last year (total current storage levels are at 13,623GL or 55% full).
The improvements in water supply, have caused prices to fall sharply from the highs seen during 2019–20. Average year to date (YTD) water prices in the sMDB during 2020–21 ($154 per ML) have been lower than they were in 2019–20 ($587 per ML). Prices have remained consistently low throughout 2021–21, reaching lows not seen since 2016–17.
Inter Valley Trade (IVT) limits continue to be a watchpoint in the market, with all major limits binding for most of 2020–21, which has limited the flow of water able to be traded between regions. As a result, price gaps have opened between catchments, although prices in all catchments remain low.
Carryover water influencing the market
Carryover is playing an increasingly important role in the market, as irrigators seek to reduce their exposure to the risks associated with climate and supply variability. A significant volume of water was carried over from 2019–20 to 2020–21, largely driven by expectations that 2020–21 was going to be a drier year. However, more favourable conditions eventuated, and it is likely that some of the water carried into 2020–21 was forfeited in accordance with state accounting rules (DPIE 2021a, DSE 2021a, DSE 2021b).
The volume of water carried over into 2021-22 is likely to be high, based on the volume of unused water in state accounts as of March 2021. ABARES approximates around half of the water available for irrigation has been used so far in 2020–21, leaving 3,814 GL still available. As the planting season for 2020-21 is already complete, ABARES estimates that most of this water will be carried over into 2021–22.
Prices likely to remain low in 2021–22
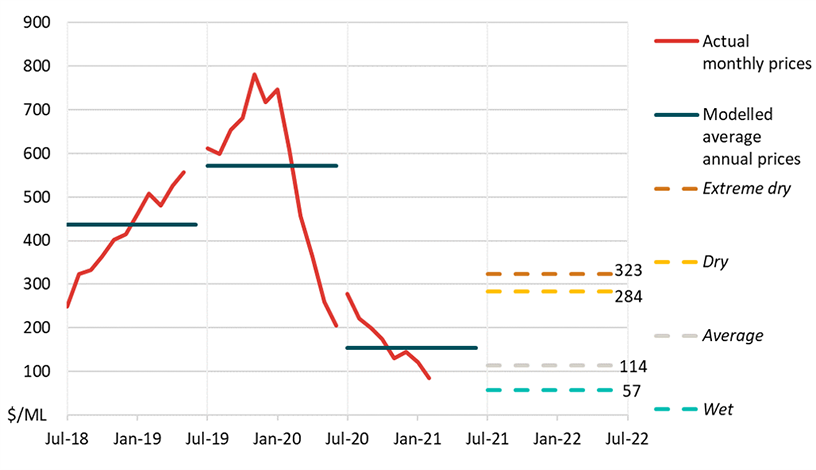
Water prices are forecast to remain low in 2021–22, with the significant volume of carryover water helping to keep prices below 2019–20 levels even in the extreme dry scenario. The average annual weighted sMDB allocation price is forecast to decrease in the wet scenario to $57 per ML (decrease of 63 per cent, relative to 2020–21), and to $114 per ML (decrease of 26 per cent) in the average scenario. In the dry and extreme dry scenarios, prices are expected to rise in 2021–22, to $284 per ML (increase of 85 per cent) and $323 per ML (increase of 110 per cent) respectively.
As favourable water supply conditions are likely in 2021-22, the Murrumbidgee IVT, and Barmah choke IVT, are expected to be open in most scenarios. With the recent changes to the Goulburn IVT, the limited capacity for northern Victorian catchments to export water to the Murray is expected to lead to price gaps between these catchments in all scenarios.
Production levels are expected to be supported by lower water prices in 2021–22 (ABARES 2021). Industries that typically rely on low water prices, such as dairy, rice and cotton, are expected to increase production significantly under the wet and average scenarios.
[expand all]
Current water market conditions
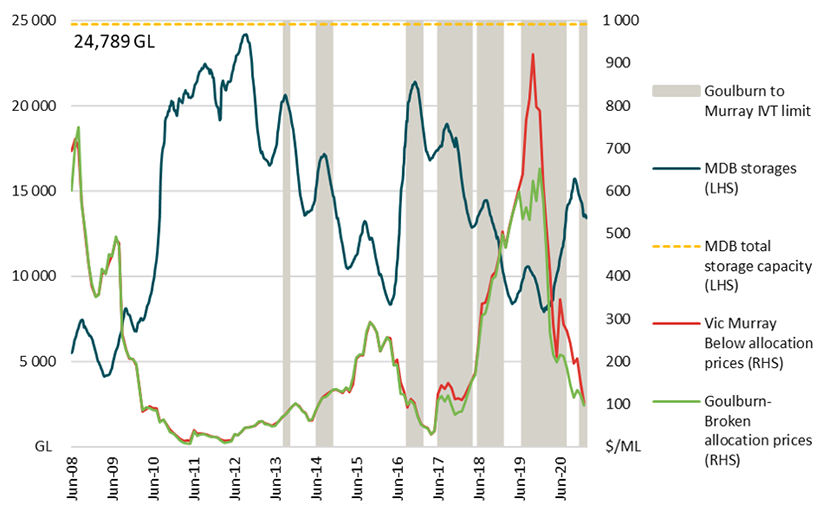
The development of La Niña conditions coupled with a negative IOD has resulted in substantial improvements in water supply in all major catchments. Large rainfall events occurred across the southern basin towards the end of 2019–20, which led to substantial improvements in storage volumes in response to higher inflows (Figure 1 and Figure 3 ).
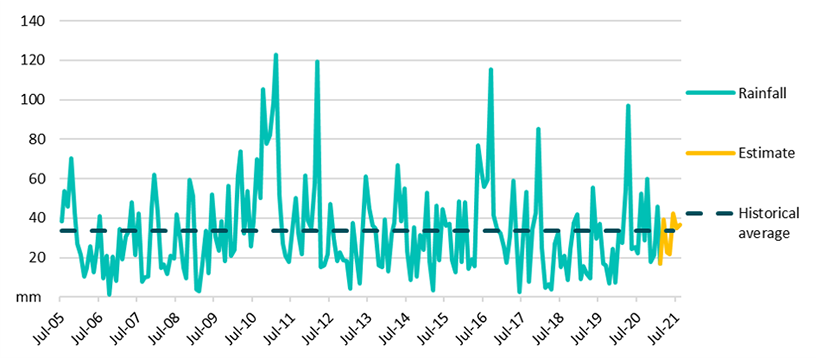
Note: See Appendix A for more information on rainfall estimation.
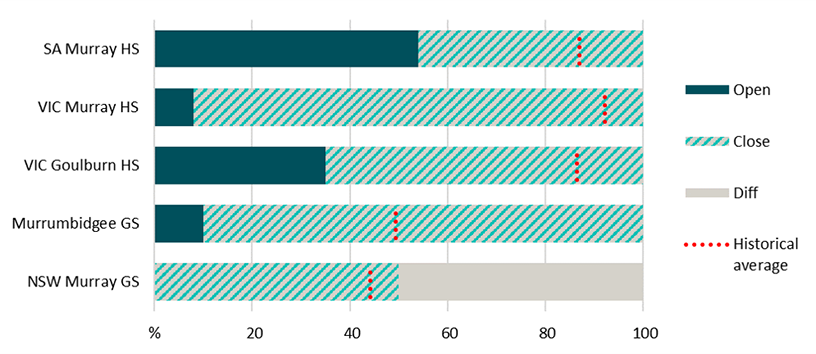
As a result, allocation levels have been above average for all major catchments and securities (Figure 2 ). NSW Murrumbidgee general security allocations have reached 100% for the first time in at least 20 years, driven by the spilling of water accounts that have hit their account limit (DPIE 2021c). NSW Murray general securities are currently 50% allocated, significantly above the 3% recorded in 2019–20. All Victorian high security entitlements have reached 100% allocations.
Water supply in 2020-21 has been further improved by high volumes of water carried over from 2019–20. This is reflected in water allocation prices, which are currently well below historical averages for all regions in the sMDB. The current YTD average weighted price for the sMDB is $154 per ML, down from $587 per ML in 2019–20 and below the 5 year average of $275 per ML.
Source: NVRM, NSW DPIE, ABARES, SA DEW
Note: Historical average calculated from 2000–01 to 2019–20. HS refers to High security entitlements. GS refers to General security entitlements.
Binding IVT limits were observed throughout 2020–21, which has caused price gaps to emerge between catchments. The YTD average price is highest in catchments below the choke ($211 per ML in the Vic. Murray) where the demand for water is greater. In comparison, the YTD average price in the NSW Murrumbidgee is $110 per ML, significantly lower than most other catchments.
IVT limits remain a watchpoint, due to their impact on water prices as well the implications for water deliverability. The Victorian Government has indicated their intention to cap deliveries from the Goulburn to the Murray to a maximum of 40 GL per month for the 2020–21 summer-autumn period (Victoria State Government 2020). The announcement also stipulated that the implementation of new trade rules would be delayed until 2021–22, with interim measures from 2019 to be extended. These announcements were made with a view to provide irrigators with more time to implement long-term changes considering the unprecedented impacts of COVID. While it is still unclear what the new trade rules will mean for the volume of water that can be traded, the effects of the interim measures are already being observed in the market. ABARES estimates around 24GL of water was traded from the Goulburn to the Murray for irrigation use in 2020-21 (well below the 3 year average of 108GL of net exports). The binding Goulburn export limit also led to price gaps between the Goulburn (YTD average price of $146 per ML) and the Murray (YTD average price of $211 per ML, in the Vic. Murray below the Barmah choke) (Figure 3).
Water used for irrigation in 2020-21 has been significantly higher than 2019–20, particularly in opportunistic irrigation sectors such as grazing pastures, rice and cotton, that rely on lower water prices.
Source: BOM, waterflow
Note: Water prices in 2020-dollar terms. Data for IVT limit starts at 21/11/2012.
Box 1 Deliverability risk
The increasing frequency and duration of binding IVT limits, combined with changing demand patterns and ecological pressures, has led to greater deliverability risk (MDBA 2020a, MDBA 2020b). As perennial horticultural crops continue to mature and the demand for water increases in catchments below the choke, the risk of a system shortfall also continues to increase.
Delivery risk – In the short term, delivery risk is the mismatch between when water is demanded and when water is released into the river. The release of water must be forecast a few weeks in advance, to account for the time it takes for the water to flow downstream. Generally, delivery risk is highest during summer, when periods of hot dry weather can see a spike in demand and/or in transmission losses due to evaporation.
System shortfall – For a water year a system shortfall will occur when the combined capacity of the system is unable to meet all demands from downstream users over the full season. In situations where a system shortfall occurs, water use in regions below the Barmah choke may have to be rationed to keep water flows through the system at an acceptable level.
Seasonal outlook
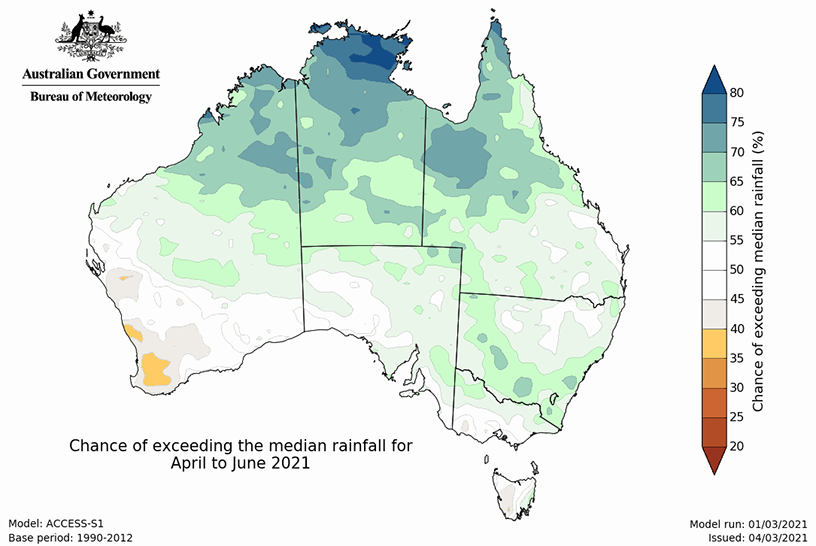
The BOM seasonal outlook for the April 2021 to June 2021 is indicating a return to neutral conditions (ABARES 2021), as the current La Niña event continues to decay (BOM 2021b). The negative IOD which helped contribute to higher rainfall in 2021, has shifted back to neutral, signalling a return to drier conditions (BOM 2021a).
Source: BOM 2021c
2021–22 water market scenarios
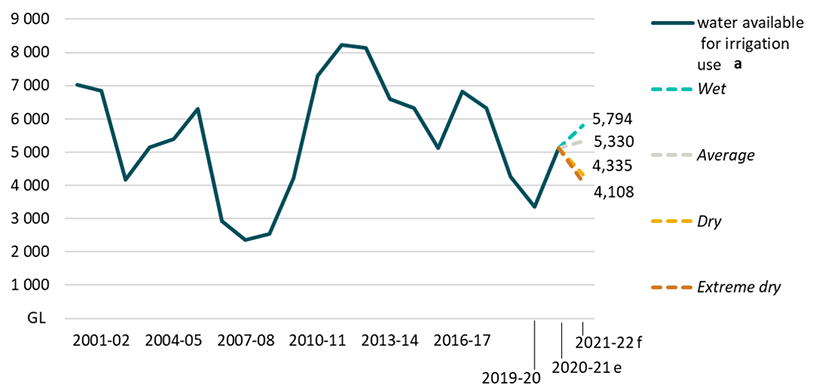
ABARES developed four scenarios for water availability in 2021–22 that draw upon the latest allocation outlooks from state water agencies as at 15 March 2021. ABARES uses these allocation forecasts and estimates carryover (excluding environmental water) to determine the volume of water available for irrigation in the sMDB under each scenario for 2021–22 (Figure 6).
The scenarios provide an indication of possible water availability levels under representative ‘extreme dry’, ‘dry’, ‘average’ and ‘wet’ conditions. Allocation levels in each scenario are determined by state water agencies based on the likelihood of inflows to storages above historical levels and estimates of rainfall (see Appendix A for more details). While methodologies vary across states, ABARES has broadly aligned the scenarios such that inflows to storages are greater in:
- 99 years out of 100 in the extreme dry scenario
- 90 years out of 100 in the dry scenario
- 50 years out of 100 in the average scenario
- 10 years out of 100 in the wet scenario
The scenarios are indicative only, and conditions could be better or worse than forecast, which would in turn affect prices. Readers should make their own judgements about the probabilities of each scenario. All four outlook scenarios are discussed in each edition of the Water Market Outlook, to provide consistent information on the effects of different seasonal conditions and related on-farm decisions such as carryover and irrigation water use.
Water supply in 2021–22
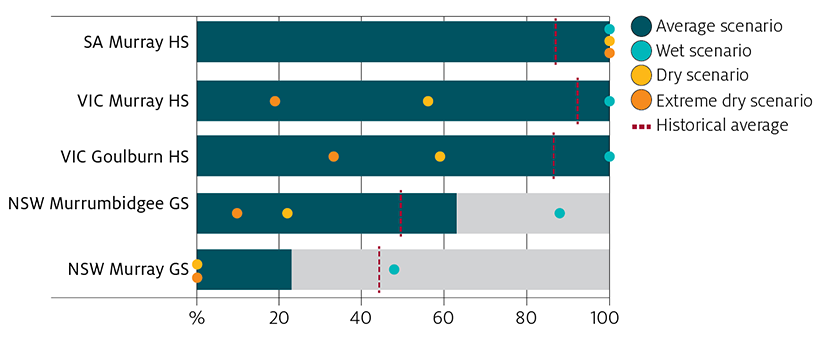
In the wet and average scenarios, allocations are likely to be higher in 2021–22 compared to the historical average (Figure 5 ). Victorian High security allocations are forecast to receive full allocations in the wet and average scenarios (NVRM 2021). In NSW, General security entitlements are forecast to receive above average allocations in the wet scenario, but below average in all other scenarios. However the current NSW allocation outlooks only go out as far as November 2021, and high volumes of carryover into 2021-22 are likely to support relatively favourable water supply conditions in the average and wet scenarios (DPIE 2021d, DPIE 2021b).
Total water supply across the southern basin in 2021–22 is forecast to increase in the wet and average scenarios, from 2020–21 (Figure 6 ). In the dry and extreme dry scenarios, water availability is expected to decrease compared to 2020-21, but will remain above 2019–20 levels. The relatively small difference in water availability in the dry scenario (4,335 GL) compared to the extreme dry scenario (4,108 GL) is due to the large volume of water likely to be carried forward into 2021-22.
Source: NVRM, NSW DPIE, ABARES
Note: Historical average calculated from 2000–01 to 2019–20
Source: ABARES estimate using data from SA DEW, NSW DPIE, NVRM and CEWH
Note: a ‘Water available for irrigation use’ is calculated as the sum of allocations, water carried over from the previous year and any water classified as uncontrolled flows, minus water allocated for the environment and water forfeited during the year. e ABARES estimate. f ABARES forecast.
Water allocation prices in 2021–22
Average annual allocation prices, annual trade flows and the volume of carryover into the following year are simulated for each region under extreme dry, dry, average and wet scenarios for 2021–22 using the ABARES Water Trade Model (Hughes, et al. 2021). Price forecasts for 2021−22 are presented in Table 1.
| Region | 2020–21 Average | Extreme Dry | Dry | Average | Wet |
|---|---|---|---|---|---|
| ($/ML) | ($/ML) | ($/ML) | ($/ML) | ($/ML) | |
| NSW Murrumbidgee | 110 | 347 | 308 | 99 | 61 |
| VIC Goulburn-Broken | 146 | 277 | 238 | 105 | 56 |
| NSW Murray Above | 154 | 347 | 308 | 132 | 53 |
| VIC Murray Below | 211 | 347 | 308 | 132 | 61 |
| SA Murray | 226 | 347 | 308 | 132 | 61 |
| Weighted sMDB average | 154 | 323 | 284 | 114 | 57 |
Source: BOM water register, ABARES, Waterflow.
Note: 2020–21 is year to date average, up to March 2021
It is important to note that these are estimates of the average annual price. In practice, prices are likely to fluctuate throughout the year around the modelled annual average price (Figure 7 ). ABARES has produced a dashboard visualisation to accompany this report, which allows for exploration of price forecasts for each region in 2021–22.
In the wet and average scenario, prices are forecast to decrease for all regions from 2020–21 prices. The weighted sMDB average price in the wet scenario is forecast to fall to $57 per ML, from $154 per ML in 2020–21, which if realised, would be the lowest average annual price since 2013–14. A more moderate decrease is forecast in the average scenario, with prices falling to $114 per ML.
The weighted average sMDB price is expected to increase in the dry ($284 per ML) and extreme dry ($323 per ML) scenarios but remain well below the average annual price observed in 2019-20 ($587 per ML).
Inter-regional trade and inter-valley trade limits in 2021-22
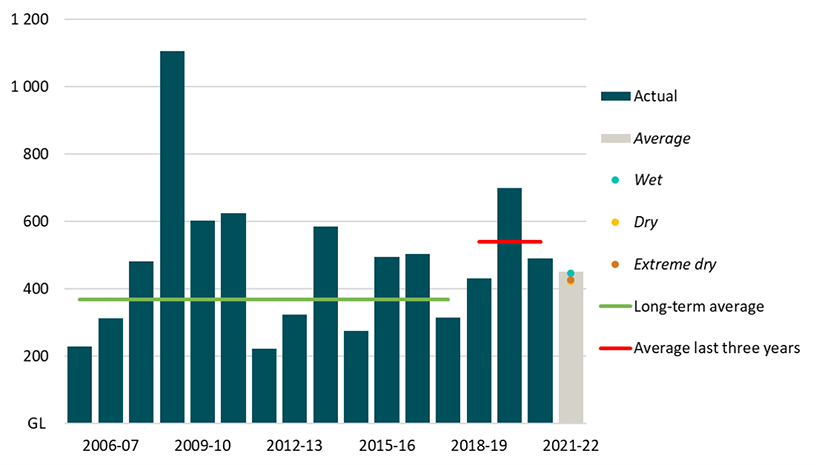
In all scenarios, the catchments below the Barmah Choke are expected to be net importers, reflecting the greater demand for water in this region (primarily from the horticultural sector). However, as water supply conditions are likely to remain favourable next year, the reliance on inter-regional trade will remain low (Figure 8 ), reducing the pressures on inter-valley trade limits. As a result, the Murrumbidgee IVT and Barmah Choke IVT are likely to remain open in most scenarios (although it is important to note that the ABARES model only simulates annual inter-regional trade flows and within year trade closures remain a possibility).
With the changes to the Goulburn IVT (discussed in the previous chapter), the export limit is likely to remain binding in all scenarios, limiting the volume of water exported from the Goulburn to the Murray. As a result, prices are forecast to be lower in the northern Victorian catchments.
Production and GVIAP in 2021–22
Production of irrigated crops, particularly rice cotton and pastures, bounced back in 2020-21, in response to favourable weather conditions, additional water availability, and lower prices relative to 2019-20 (SunRice 2021, ABC 2021a, ABARES 2021). The Australian almond industry is also expecting a record harvest in 2020–21, as almond plantings reach maturity (ABC 2021d).
Looking ahead, in the wet and average scenarios for 2021-22, production of irrigated crops in the sMDB is modelled to further increase (Table 2 ), while in the dry and extreme dry scenarios, production is modelled to decrease compared to 2020-21. These results are consistent with the forecasts of allocation prices discussed in the previous section (Table 1).
Opportunistic crops (particularly rice, and to a lesser extent cotton) that are typically more sensitive to water prices, are forecast to increase production substantially in the wet and average scenarios in response to lower prices. Dairy production is forecast to remain relatively stable across all scenarios, with a marginal increase in the average and wet scenarios. Almond production increases in all scenarios and is primarily a function of the age profile of almond trees (which is assumed to be the same across all scenarios).
| Industry | Units | 2020–21 modelled | Extreme Dry | Dry | Average | Wet |
|---|---|---|---|---|---|---|
| Almonds | tonnes | 91,209 | 99,341 | 99,341 | 99,341 | 99,341 |
| Cotton | tonnes | 127,291 | 96,616 | 102,367 | 135,904 | 142,727 |
| Grapevines | tonnes | 1,226,357 | 1,184,305 | 1,199,678 | 1,291,772 | 1,281,058 |
| Rice | tonnes | 479,317 | 283,851 | 327,994 | 727,726 | 1,015,351 |
Source: ABARES, SunRice
The total Gross value of Irrigated Agricultural Production (GVIAP) in the southern basin is expected to increase in the average and wet scenarios compared to 2020–21 and decrease in the extreme dry and dry scenarios.
| Industry | 2020–21 modelled | Extreme Dry | Dry | Average | Wet |
|---|---|---|---|---|---|
| Almonds | 722 | 768 | 768 | 768 | 768 |
| Cotton | 310 | 239 | 253 | 336 | 353 |
| Dairy | 813 | 771 | 779 | 810 | 821 |
| Pastures for grazing and for hay | 644 | 576 | 590 | 672 | 660 |
| Horticulture (incl. fruit & vegetables) | 1874 | 1967 | 1958 | 1925 | 1876 |
| Grapevines | 655 | 636 | 645 | 694 | 688 |
| Rice | 207 | 123 | 142 | 315 | 440 |
| Other cereals and broadacre | 265 | 227 | 233 | 279 | 240 |
| Total | 5490 | 5308 | 5368 | 5799 | 5847 |
Source: ABARES
Note: GVIAP estimates do not include nursery production and are therefore not comparable to ABS estimates.
Appendix A: ABARES outlook scenarios
ABARES outlook scenarios
ABARES designed four outlook scenarios for 2021–22 (Table A1). It is important to note that outlook scenarios released by the states remain indicative only. Actual water allocations will depend on realised seasonal conditions. Outlook scenarios are also subject to updates throughout the year.
As shown in Table A1 , the definition of outlook scenarios and the level of information provided can vary by state water agency. The ABARES outlook scenarios are largely based on those used by the Northern Victoria Resource Manager (NVRM). Outlook scenarios from other states are matched against the ABARES scenario definitions.
| ABARES scenario | NVRM scenario | SA DEW scenario | NSW DPIE scenario |
|---|---|---|---|
| Extreme dry In 99 years out of 100, inflows to storages exceed those experienced in this scenario. Rainfall is in the 1st percentile of historical levels. |
Extreme dry Inflow volumes to storages that are greater in 99 years out of 100. |
Exceptionally dry 99% likelihood that actual allocations will exceed allocation forecast |
Extreme 99 chances in 100 of exceeding the allocation forecast |
| Dry In 90 years out of 100, inflows to storages exceed those experienced in this scenario. Rainfall is in the 10th percentile of historical levels. |
Dry Inflow volumes to storages that are greater in 90 years out of 100. |
Very Dry 90% likelihood that actual allocations will exceed allocation forecast |
Very Dry 9 chances in 10 of exceeding the allocation forecast |
| Average In 50 years out of 100, inflows to storages exceed those experienced in this scenario. Rainfall is in the 50th percentile of historical levels. |
Average Inflow volumes to storages that are greater in 50 years out of 100. |
Average 50% likelihood that actual allocations will exceed allocation forecast |
Average 1 chance in 2 of exceeding the allocation forecast |
| Wet In 10 years out of 100, inflows to storages exceed those experienced in this scenario. Rainfall is in the 90th percentile of historical levels. |
Wet Inflow volumes to storages that are greater in 10 years out of 100. |
Wet 25% likelihood that actual allocations will exceed allocation forecast |
Wet NSW has not released a forecast for this scenario. ABARES assumption. |
Source: ABARES, NVRM, SA DEW and NSW DPIE
Note: Allocation forecasts made by NVRM are created using a model of historical inflow volumes, and the chance that actual inflows will be higher than those presented. The wet scenario defined by SA DEW uses a higher likelihood measure, meaning this is a drier scenario than the wet scenario used by ABARES and defined by NVRM.
For each of these scenarios, ABARES has estimated allocations made against each entitlement type, annual rainfall by catchment and the volume of water carried over into 2021–22.
The scenarios describe four potential outcomes for the volume of water available for irrigation use in the southern basin in 2021–22. In each scenario, the aggregate demand for irrigation water is assumed to be the same (i.e. at 2020–21 levels). Therefore, prices in each scenario are primarily influenced by seasonal conditions, the volume of water available (which is affected by allocation and carryover forecasts), rainfall (which affects crop water requirements) and trade limits that restrict the flow of water between catchments.
Rainfall
Table A2 shows the estimated level rainfall for 2020–21 and 2021-22. For 2020-21 historic year to date observed rainfall has been combined with the BOM median forecast for the remainder of the year. For 2021–22 by catchment for each outlook scenario. This is calculated as a percentile of historical annual rainfall between 2000–01 and 2019–20.
| Region | 2020–21 | 2021–22 Extreme Dry (mm) |
2021–22 Dry (mm) |
2021–22 Average (mm) |
2021–22 Wet (mm) |
|---|---|---|---|---|---|
| NSW Lower Darling | 240.6 | 124.0 | 125.6 | 178.7 | 288.3 |
| NSW Murray Above | 303.9 | 190.5 | 217.9 | 297.2 | 437.2 |
| NSW Murray Below | 255.3 | 160.2 | 171.4 | 246.1 | 379.5 |
| NSW Murrumbidgee | 372.0 | 190.0 | 215.4 | 292.3 | 430.1 |
| SA Murray | 213.0 | 145.3 | 156.9 | 203.3 | 312.4 |
| VIC Goulburn-Broken | 359.3 | 238.6 | 258.5 | 349.3 | 512.7 |
| VIC Loddon-Campaspe | 370.6 | 229.8 | 261.5 | 319.3 | 495.9 |
| VIC Murray Above | 492.1 | 260.5 | 315.1 | 455.7 | 590.0 |
| VIC Murray Below | 233.2 | 142.4 | 154.3 | 205.0 | 349.5 |
Source: BOM
Note: 2020–21 scenario values are ABARES estimate
2021–22 scenario values are ABARES forecasts
Allocations
Table A3 shows the allocation forecasts by entitlement type for 2021–22. While these predominantly reflect the outlook, scenarios released by the state water agencies, ABARES has also made some additional assumptions.
- In Victoria, ABARES has assumed no allocations are made against low reliability entitlements in 2021–22.
- South Australian Class 3a entitlements are assumed to be comparable to high reliability entitlements in Victoria and NSW.
- For New South Wales catchments, a wet scenario forecast was not provided, and as such, ABARES assumes that under a wet scenario allocations forecasts will increase by 25% relative to the average scenario.
- Allocations for Vic. Murray above and below (the Barmah choke) are assumed to receive the same allocation percentage as each other. The same assumption is made for NSW Murray above and below regions.
- ABARES has assumed that South Australian entitlements will receive full allocations under all scenarios, based on historical trends.
| Region | Security | Extreme Dry (%) |
Dry (%) |
Average (%) |
Wet (%) |
|---|---|---|---|---|---|
| NSW Murray | General | 0 | 0 | 23 | 48 |
| NSW Murray | High | 97 | 97 | 97 | 97 |
| NSW Lower Darling | General | 0 | 0 | 25 | 50 |
| NSW Lower Darling | High | 100 | 100 | 100 | 100 |
| NSW Murrumbidgee | General | 10 | 22 | 63 | 88 |
| NSW Murrumbidgee | High | 95 | 95 | 95 | 95 |
| VIC Murray | High | 19 | 56 | 100 | 100 |
| VIC Goulburn | High | 33 | 59 | 100 | 100 |
| VIC Campaspe | High | 4 | 22 | 100 | 100 |
| VIC Loddon | High | 33 | 59 | 100 | 100 |
| VIC Broken | High | 0 | 41 | 100 | 100 |
| SA Murray | High | 100 | 100 | 100 | 100 |
Source: NSW DPIE, NVRM, ABARES
Carryover
Table A4 shows the volume of water carried over into 2021–22 and ABARES forecast for carryover into 2022–23. Carryover is modelled taking into account forecasts for rainfall, entitlements on issue and allocations, along with state-based carryover rules. Included in ABARES forecasts are modelled irrigator expectations around climate in 2022–23 (See Hughes et al. 2021, for more details). Overall the results suggest lower levels of carryover into 2022–23 compared to 2021–22, under all scenarios, as irrigators draw down their reserves.
| Region | 2021–22 (ml) |
2022–23 Extreme dry (ml) |
2022–23 Dry (ml) |
2022–23 Average (ml) |
2022–23 Wet (ml) |
|---|---|---|---|---|---|
| NSW Murrumbidgee | 752,886 | 233,418 | 392,760 | 567,599 | 567,599 |
| NSW Murray | 941,453 | 508,453 | 714,078 | 836,049 | 355,775 |
| VIC Murray | 970,045 | 0 | 140,489 | 355,697 | 1,322,215 |
| VIC Goulburn-Broken | 949,273 | 345,424 | 452,325 | 832,361 | 1,101,682 |
| VIC Loddon-Campaspe | 54,966 | 9,851 | 72,110 | 0 | 0 |
| Total | 3,668,622 | 1,097,147 | 1,771,762 | 2,591,705 | 3,347,270 |
Note: Scenario values are ABARES forecast.
References
ABARES 2021, Agricultural commodities: March quarter 2021, Australian Bureau of Agricultural and Resource Economics and Sciences, DOI: doi.org/10.25814/r3te-d792, accessed 16 March 2021.
ABC 2021a, Cotton industry rebounds as harvest starts on potential $1.5 billion crop, but China still not buying, Australian Broadcasting Corporation, Melbourne, 20 February, accessed 18 March 2021.
ABC 2021b, La Niña drives cooler temperatures, high rainfall during Australian summer, Australian Broadcasting Corporation, Melbourne, 3 March, accessed 11 March 2021.
ABC 2021c, Murrumbidgee Valley irrigators back with summer crops, full water allocation after years of drought, Australian Broadcasting Corporation, Melbourne, 24 January, accessed 18 March 2021.
ABC 2021d, Record almond harvest is coming despite a challenging year for agriculture, Australian Broadcasting Corporation, Melbourne, 29 January, accessed 10 February 2021.
ABC 2020, Australia's rice bowl primed for bumper harvest as production lifts tenfold with water, Australian Broadcasting Corporation, Melbourne, 18 December 2020, accessed 18 March 2021.
ABS 2021, Consumer price index, Australia cat. No. 6401.0, Australia Bureau of Statistics, Canberra, accessed 16 March 2021.
BOM 2021a, Climate driver update, Bureau of Meteorology, Melbourne, accessed 15 March 2021.
BOM 2021b Climate influences, Bureau of Meteorology, Melbourne, 11 March, accessed 17 March 2021.
BOM 2021c Climate outlooks maps, Bureau of Meteorology, Melbourne, accessed 15 March 2021.
BOM 2021d Climate outlooks – weeks, months and seasons, Bureau of Meteorology, Melbourne, accessed 15 March 2021.
BOM 2021e Water information, Bureau of Meteorology, Melbourne, accessed 15 March 2021.
BOM 2021f, Water storage dashboard, Bureau of Meteorology, Melbourne, accessed 10 March 2021.
BOM 2020, Australia in spring 2020, Bureau of Meteorology, Melbourne, 1 December, accessed 6 December 2020.
DPIE 2021a, Accounting Rules Summary Department of Planning, Industry & Environment, Sydney, 15 March, accessed 15 March 2021.
DPIE 2021b, Murrumbidgee valley, water allocation statement Department of Planning, Industry & Environment, Sydney, accessed 15 March 2021.
DPIE 2021c, Murrumbidgee valley, water allocation statement, Department of Planning, Industry & Environment, Sydney, 15 January, accessed 15 January 2021.
DPIE 2021d NSW Murray and Lower Darling, water allocation statement, Department of Planning, Industry & Environment, Sydney, accessed 15 March 2021.
DPIE 2021e, Allocation dashboard, Department of Planning, Industry & Environment, Sydney, accessed 17 March 2021.
DPIE 2021f, Usage dashboard, Department of Planning, Industry & Environment, Sydney, accessed 17 March 2021.
DSE 2021a, How carryover works on the Murray, Goulburn and Campaspe, Department of Sustainability and Environment, Melbourne, accessed 10 March 2021.
DSE 2021b, Why you can't use your spillable water, Department of Sustainability and Environment, Melbourne, accessed 10 March 2021.
Goesch, T, Legg, P & Donoghoe, M 2020, Murray-Darling Basin water markets: trends and drivers 2002-03 to 2018-19, ABARES research report, Canberra, February, CC BY 4.0, DOI: 0.25814/5e409ea3cb1fc, accessed 7 March 2021.
Gupta, M, Hughes, N & Wakerman Powell, Kai 2018, A model for water trade and irrigation activity in the southern Murray-Darling Basin, ABARES conference paper, Canberra, accessed 7 March 2021.
Gupta, M & Hughes, N 2018, Future scenarios for the southern Murray–Darling Basin water market, ABARES research report, Canberra, August. CC BY 4.0, DOI: 10.25814/5e5c8daaa823a, accessed 8 March 2021.
Hughes N, Gupta, M, Whittle, L & Westwood, T 2021, A model of spatial and intertemporal water trade in the southern Murray-Darling Basin, ABARES Working Paper, Canberra, February, CC BY 4.0, DOI: 10.25814/2yav-hb85, accessed February 2021.
Brown, A, De Costa, C & Guo, F 2020, Our food future: trends and opportunities, ABARES, Research Report 20.1, Canberra, January, DOI: 10.25814/5d9165cf4241d. CC BY 4.0
Luke, J 2021, Update on production at SunRice’s Riverina facilities (pdf 299kb), media release, SunRice Group, Leeton, New South Wales, 18 February, accessed 18 March 2021
MDBA 2020a, Managing delivery risks in the River Murray system, Murray Darling Basin Authority, Canberra, accessed 10 March 2021.
MDBA 2020b, River Murray system annual operating outlook: 2020-21 water year update, Murray Darling Basin Authority, Canberra, accessed 5 March 2021.
Neville, L 2020, Delivering for basin water users, media release, Minister for Water, Department of Environment, Land, Water and Planning, Melbourne, 13 August 2020, accessed 5 February 2021.
NVRM 2021, Current Outlook, Northern Victoria Resource Manager, Tatura, Victoria, accessed 16 March 2021.
Sanders, O, Hughes, N, and Gupta, M 2019, Measuring water market prices, ABARES research report, report to client prepared for the Department of Agriculture and Water Resources, Canberra, March. CC BY 4.0, DOI: 10.25814/5c5388a92260d, accessed 4 March 2021.
Victoria Water Register 2021, Seasonal determinations, Victoria Water Register, Melbourne, accessed 15 March 2021.
Victoria Water Register 2021a, Available water by owner type, Victoria Water Register, Melbourne, accessed 16 March 2021.
Victoria Water Register 2021b, Trade opportunities, Victoria Water Register, Melbourne, accessed 18 March 2021.
Victoria Water Register 2021c, Unused water, Victoria Water Register, Melbourne, accessed 18 March 2021.
Victoria Water Register 2019 Changes to Goulburn system trade and operational arrangements, Victoria Water Register, Melbourne, accessed 16 March 2021.
Waterflow 2021, Temporary water, Waterflow, accessed 15 March 2021.
Waterflow 2021, Trade limits, Waterflow, accessed 15 March 2021.
Westwood, T, Qin, C & Whittle, L 2020, Water market outlook: July 2020, Australian Bureau of Agricultural and Resource Economics and Sciences, DOI: 10.25814/5f0fb376d14e4, Canberra, accessed 10 January 2021.
Watch ABARES video presentation
Watch a presentation from ABARES Water Analyst Tim Westwood as he summarises the key findings from this report.
Download the report
Water Market Outlook: March 2021 – PDF [1.19 MB]
Water Market Outlook: March 2021 – DOCX [1.78 MB]
Previous reports
Water Market Outlook – March 2020
Water Market Update – June 2020
Water Market Outlook – July 2020
For access to other past water markets outlook reports, visit the ABARES publications library.

