Authors: Mihir Gupta, Neal Hughes, Linden Whittle and Tim Westwood.
Summary
This report presents recent economic modelling undertaken by ABARES to support the Independent Assessment of Social and Economic Conditions in the Basin. In particular, this report presents a series of forward looking scenarios for the southern Murray-Darling Basin water market, examining potential future water prices, trade flows and irrigation sector outcomes, taking into account recent and expected trends for water supply and demand. These results are generated using the ABARES Water Trade Model: a data-driven economic model of the southern Murray-Darling Basin water market.
The scenarios
Three scenarios are considered:
| Current market | Current irrigation development (horticultural plantings), current water recovery under the Basin Plan, current trade rules and commodity prices. |
| Future market | Full maturity of recently established almond plantings, and future water recovery to meet Basin Plan requirements (3,200 GL target) via on-farm infrastructure upgrades. |
| Future market (dry) | As above, but with an 11 per cent reduction in water supply and a 3 per cent reduction in rainfall. |
For each scenario, a range of water supply conditions are simulated (based on the historical climate sequence 2005-06 to 2018-19) to provide a picture of potential water market and irrigation outcomes across representative ‘dry’, ‘average’ and ‘wet’ years.
There are two key caveats to these scenarios. Firstly, the climate sequence used (2006 to 2019) is particularly dry in the context of the longer historical record and may differ from average future climate conditions. Secondly, these scenarios are based on current farms using current capital and technology, and do not allow for long-term adaptation (innovation / technological change) or structural adjustment (changes in capital investment).
Key findings
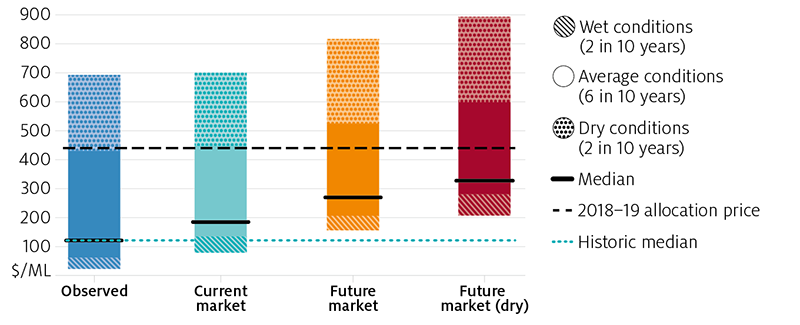
- Higher water prices: a significant increase in average water allocation market prices is estimated across the southern Murray Darling Basin. Compared to the current market scenario, allocation prices are estimated to be 28 per cent higher in the future market scenario and 50 per cent higher in the future market (dry) scenario. In the future market scenario prices are estimated to remain above $200 per ML in 8 out of 10 years. While water prices in 2018–19 (around $445 per ML) would be considered high relative to historically observed prices, the same price would be considered an average price in the future, occurring much more frequently. Larger price increases are modelled in dry years under both the future market (up to $116/ML higher) and future market (dry) (up to $192/ML higher) scenarios.
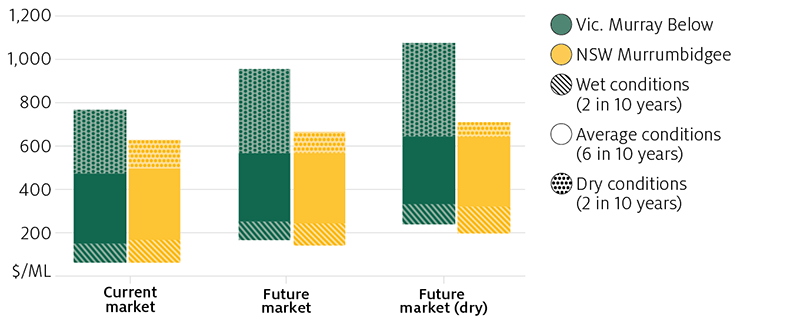
- Inter-regional trade limits having a larger effect: growth in water demand in the lower Murray due to maturing Almonds trees (particularly in NSW and SA Murray), leads to greater pressure for inter-regional water trade, more frequently binding trade limits and large differences in prices between regions. Particularly in dry years, trade limits lead to significantly higher prices in the Murray below Barmah region (between $955/ML and $1075/ML) compared to the Murrumbidgee (between $665/ML and $712/ML).
- Just enough water to maintain horticultural plantings in dry years: While water supply (including both surface water and other sources such as groundwater) is sufficient to meet estimated demand from horticultural plantings (fruits, nuts and grapevines) in all scenarios, in practice there remains some risk of supply shortfalls within each water year, particularly if future conditions are drier than modelled or trade constraints are tightened. Horticultural plantings are estimated to use around 1276 GL on average each year in the ‘future scenarios’.
- Reductions in water use in some traditional irrigation sectors and regions: water use in the dairy and rice sectors is modelled to decrease on average by 14 per cent and 15 per cent respectively in the future market scenario (relative to the current market scenario). In dry years, more significant decreases are predicted for these sectors in order to meet horticultural water demand, with dairy and rice decreasing by up to 55 per cent and 32 per cent respectively. Average water use declines by around 18% in the Goulburn-Broken region and around 7% in the Murrumbidgee in the future market scenario.
- Decrease in GVIAP for traditional irrigation sectors: gross value of irrigated agricultural production (GVIAP) is modelled to decrease for the dairy and rice sectors on average by 9 per cent and 13 per cent respectively in the future market scenario (relative to the current market scenario). In contrast, existing almond plantings, assumed to be fully mature in the future, drive a substantial increase in production and gross value (around 23 per cent for both) for the almond sector. The decrease in other sectors is partially offset by an increase in farm productivity, through on-farm infrastructure upgrades. The dairy sector is also able to reduce the effect of high water prices by substituting water for fodder. Overall, the total GVIAP across all sectors is modelled to increase on average by 0.8 per cent in the future market scenario and decrease by 4.1 per cent in the future market (dry) scenario.
Background
The sMDB water market
The Water Act was passed in 2007 and the Murray-Darling Basin Plan was introduced in 2012, with the aim of addressing long-term environmental problems from over extraction. Since 2007, more than 2,100 GL of water rights have been recovered for environmental use (DA 2019), nearly 20 per cent of water supply.
Water markets have been a key institutional response, ensuring water flows to its highest value use, and helping the irrigation sector adapt to reductions in supply. However, in recent years, water markets in the southern basin have been under significant pressure. A combination of lower water supply (brought about by environmental water recovery and lower inflows due to climate change) and higher irrigation demand (particularly from horticulture) have seen water prices increase dramatically, with some water rights increasing in value by around 200 per cent between 2013 and 2019.
With an additional 501.6 GL of environmental water recovery still to be completed under the Basin Plan, the government established an independent panel to examine potential futures for the Murray Darling Basin (MDB), with a particular focus on the socio-economic effects of the Basin Plan on river communities. ABARES was contracted by the panel to contribute to this analysis using the Water Trade Model, with its ability to separate the effects of climate, policy and economic shocks on the southern Murray-Darling Basin water market.
Simulations are presented in this report for long-term future water allocation prices and irrigation activity under plausible future scenarios, while controlling for external factors such as commodity prices, trade limits and climate.
The Water Trade Model
ABARES has developed an economic model of water trade and irrigation activity in the southern Murray-Darling Basin (sMDB). The model has been extensively documented in past reports (see Hughes et. al. 2016, Gupta et. al. 2018, Gupta and Hughes 2018). Recent updates to the model, will be documented in a separate forthcoming report.
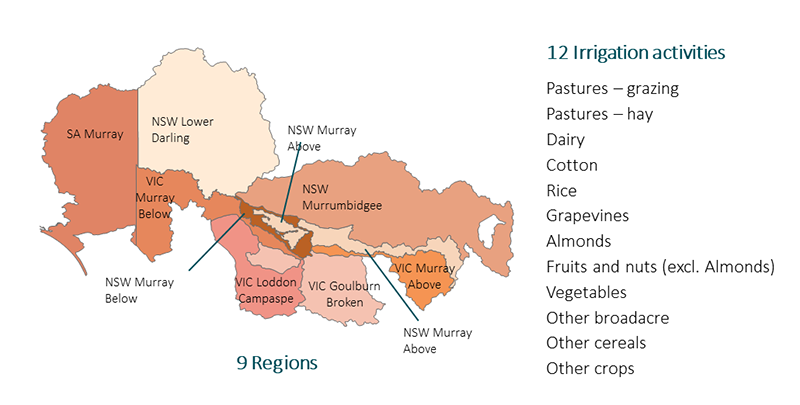
The model is estimated using historical data from 2005–06 to 2018–19 (14 years). The irrigation activities considered in the model and the catchment regions are shown in Figure 1. A unique comprehensive dataset was developed for the model, detailing water availability (entitlements, allocations and carryover), market outcomes (prices and trade flows), irrigation activity (area irrigated and water use), climate (rainfall) and commodity prices. The model also defines ‘other water’ to take into account differences between irrigation water use (based on farm reported values) and allocation water supply (based on regulated surface water entitlements).
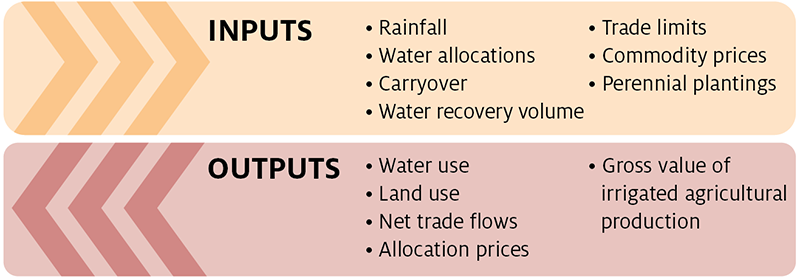
The inputs and outputs for the water trade model are listed in Figure 2, and can be modified to design various scenarios. For more detail see Appendix A.
Limitations of this analysis
There are some caveats to the results presented in this report, listed below, that reflect the short-term nature of the ABARES Water Trade Model and the scenarios considered in this analysis. Nevertheless, the results provide an indication of potential future trends in sMDB water markets, and a deeper understanding of the drivers of water demand and supply in the region.
- The analysis is based on current farms using current capital and technology, and do not allow for long-term adaptation or structural adjustment.
- The historical climate conditions assumed for the Current market and Future market scenarios are drier that the average for the longer historical record, and may differ from typical future climate conditions.
- The analysis does not provide a prediction of future prices or irrigation activity. Results are presented for representative ‘dry’, ‘average’ and ‘wet’ seasonal conditions, and are not forecasts for specific future periods.
- Trade rules are assumed reflect market conditions in 2018–19, and do not account for possible changes to the Goulburn Inter-Valley Trade limit or other trade rules.
- Commodity prices are also fixed to observed values in 2018-19. Prices higher or lower than assumed will alter the demand for water from farms producing that commodity, and hence their overall water use and production.
- The analysis does not include consideration of potential benefits from environmental water recovery to the irrigation sector (for example, potentially improved water quality or delivery), or to the broader community. Measuring these benefits would require data and methods beyond the scope of this project.
- The analysis assumes that environmental water recovery is fully complete in each of the future scenarios. ABARES has not considered the feasibility of recovering the remaining environmental water by any particular date.
Scenarios
The ABARES Water Trade Model was used to estimate water allocation prices, water trade and irrigation activity under three different scenarios (Table 1). The current market scenario holds all water market drivers (including water recovery, almond water use and commodity prices) fixed at currently observed levels (i.e. 2018–19), in order to provide an accurate comparison point for ‘future scenario’ results. The ‘future scenarios’ (future market and future market (dry)) are designed to provide insight for plausible futures for the southern Murray-Darling Basin, and have been developed in consultation with the panel, the Murray-Darling Basin Authority (MDBA) and Marsden Jacob Associates (MJA).
In the future market scenario, water recovered under the Basin Plan is completed in full and a further 501.6 GL of water rights (in LTAAY terms) is recovered across the basin. This future water recovery is assumed to occur via on-farm infrastructure upgrades. The scenario also takes into account an increase in farm productivity and water demand due to the effects of these upgrades.
In addition, all existing almond trees are assumed to be fully mature, thereby increasing the demand for water from the almond industry. This predominantly affects the lower Murray regions (particularly the SA Murray and NSW Murray below Barmah), where new plantings have occurred in recent years.
In the future market (dry) scenario, these assumptions are all repeated, and climate change is assumed to further reduce rainfall and water supply. Previous work undertaken by CSIRO (2008) was used to inform the assumptions in this scenario.
| Name | Rainfall | Allocation volume | Water recovery (a) | Recovery mechanism | Trade limits | Commodity prices | Water demand | |
|---|---|---|---|---|---|---|---|---|
| R | Current market (c) | No change | No change | Current | Current | Current | Current | Current |
| SCENARIOS | ||||||||
| 1 | Future market | No change | No change | Future recovery | 100% through on-farm programs | Current | Current | Modelled increase (b, d) |
| 2 | Future market (dry) | 3% decrease | 11% decrease | Future recovery | 100% through on-farm programs | Current | Current | Modelled increase (b, d) |
Note: (a) Water recovery target for the Murray-Darling Basin as a whole. (b) Water demand refers to irrigator’s willingness to pay for water. (c) Current market scenario is a reference case that assumes current water demand and supply conditions, and results differ from observed historical trends in prices and irrigation activity. (d) Water demand increases due to maturing of current almond plantings, and the effect of increased productivity and water use efficiency for farms participating in on-farm water recovery programs.
The ABARES Water Trade Model is short-term and static in nature, and does not allow for future structural change (for example: changes in horticultural plantings, or reductions in the size of the dairy herd). Future changes in productivity or technological advancements are also not taken into account. Therefore, the results presented in this report are not forecasts of future water prices in specific years.
However, the model can be used to assess scenarios and examine the effects of specific changes – such as those designed for the ‘future scenarios’. In this report, the model uses a historical climate sequence to provide a picture of how the market might perform under a range of water supply conditions, including dry, wet and average years. As such the results are best interpreted as a distribution, where each ‘year’ could be considered an individual scenario.
Results
Water supply for irrigation use will decrease
One of the major changes considered in the ‘future scenarios’ is a decrease in irrigation water supply across the southern basin. In both scenarios, an additional 501.6 GL of water rights are assumed to be recovered across the MDB. Moreover in the future market (dry) scenario, climate change is assumed to further decrease rainfall and water supply (informed by previous assessments of future water availability undertaken by CSIRO 2008).
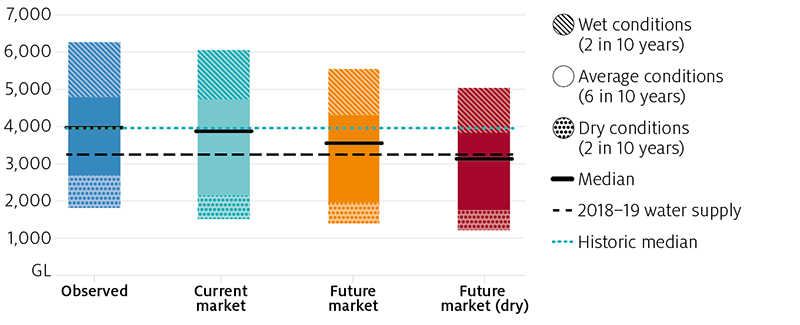
The resulting distributions of future water supply in the southern basin can be seen in Figure 3. Water availability for irrigation is expected to be lower in the future, decreasing on average by around 300 GL in the future market scenario, and 700 GL in the future market (dry) scenario, compared to the current market scenario. In the future market (dry) scenario, water supply across the southern basin is expected to be lower than 3800 GL in 8 out of 10 years. While the effects are spread across all catchments in the connected southern basin, the biggest decreases in water supply (before trade) occur in the SA Murray and the Vic. Murray.
Source: ABARES
Demand for water will increase
Anticipated changes in water demand are the other major driver of water allocation prices and inter-regional trade in the southern basin in the ‘future scenarios’. In both scenarios, the area planted with almond trees is not assumed to increase; however, all existing almond trees are assumed to be fully mature (bearing), thereby increasing the demand for water from the almond-growing industry. It is important to note that the proportion of bearing to non-bearing trees varies substantially by catchment. For example, in the Vic. Murray, almost all existing almond trees are bearing (around 95 per cent), while in the SA Murray, only around half of the existing trees are bearing. This has a considerable effect on where the demand for water increases in the future.
Additionally, the future scenarios take into account an increase in farm productivity and water demand due to the effects of on-farm infrastructure upgrades.
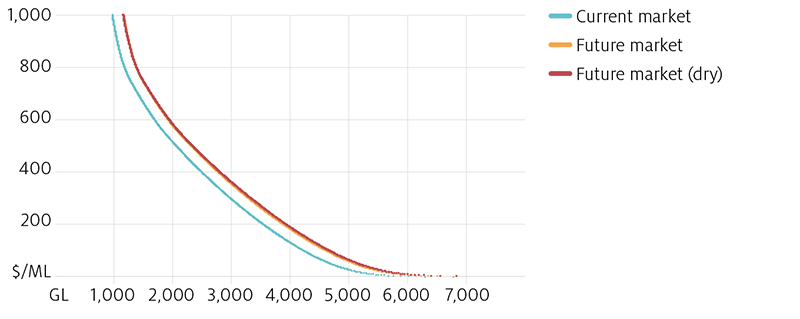
Taking these likely changes in water demand into account, Figure 4 presents the total water demand across the southern basin for prices between $1/ML and $1000/ML for each scenario. As shown, the demand for water increases in the ‘future scenarios’ compared to the current market scenario. The total demand for water is marginally higher in the future market (dry) scenario compared to the future market scenario due to marginally lower on-farm rainfall (a 3 per cent decrease is assumed).
Source: ABARES
Prices will likely be higher
Figure 5 shows the distribution for modelled water allocation prices in the southern Murray-Darling Basin. Compared to the current market scenario, there is a significant increase in water prices in each of the future scenarios. In the future market scenario, on average, around two-thirds of the increase in prices is attributed to the additional recovery of water through on-farm programs, while a third is attributed to greater water demand from the almonds sector.
While the average annual price in 2018–19 (around $445/ML) would be considered high in the current market scenario, occurring in just 3 out of 10 years, the same price would be considered an average price in the future market (dry) scenario, occurring much more frequently. Importantly, the range for water prices in both ‘future scenarios’ is also considerably higher; prices above $200/ML were modelled in 8 out of 10 years in the future market scenario, and in all years in the future market (dry) scenario (see Table B1 and B5). This will likely place some pressure on irrigation industries such as dairy and rice, which have historically used much less water than other sectors, during years with high water prices.
The economic impact of higher water prices on irrigators will vary substantially between individuals. Farmers who have made the decision to own much of the water they use will most likely be better off if water prices increase – both in terms of income and wealth – while farmers who rely heavily on purchasing water allocations will likely be worse off. Detailed analysis of water ownership and use is beyond the scope of this analysis.
It is worth noting that results are presented here as average annual prices across the southern basin. Prices typically vary across catchments when trade constraints are binding and can also vary substantially within each water year.

Allocation prices are sensitive to changes in rainfall and supply
In the future market (dry) scenario, seasonal conditions are assumed to be drier than historically observed. A 3 per cent decrease in rainfall is assumed, leading to greater demand for irrigation water, as well as an 11 per cent decrease in surface water supply. These assumptions are consistent with assessments of future water availability undertaken by CSIRO (2008).
Allocation prices are quite sensitive to changes in rainfall and water supply, increasing by 17 per cent on average in the future market (dry) scenario, compared to the future market scenario. Most of this increase (around 90%) is due to a reduction in the availability of surface water.
It is possible that the drought conditions experienced in 2019–20 (or in other years in the future) could be wetter or drier than those observed historically or assumed in the future market (dry) scenario, and therefore prices could be lower or higher than the ranges presented in this report.
Water use in traditional irrigation sectors will decrease
The average annual future water use across the southern basin is presented by activity in Figure 6. Total water use is expected to decrease by around 3 per cent in the future market scenario and 12 per cent in the future market (dry) scenario compared to the current market scenario. The changes in average water use across the southern basin are smaller than the changes in water supply described in Figure 3, as there are also other sources for water supply (such as groundwater and on-farm storages) which are accounted for in the model.
Water markets in the southern basin have evolved to facilitate the flow of water towards its highest value use. Despite the decrease in total water use (and water supply), there is a significant increase in water use for almonds (around 41 per cent compared to the current market scenario), as water is redirected from other irrigation activities such as rice (which decreases on average by 15 and 31 per cent in the future market and future market (dry) scenarios respectively) and dairy (decreases on average by 14 and 24 per cent in the future market and future market (dry) scenarios respectively). In dry years, more significant decreases are predicted for these sectors, with dairy and rice water use decreasing by up to 55 per cent and 32 per cent respectively. Table B4 shows the modelled change in water use by catchment.
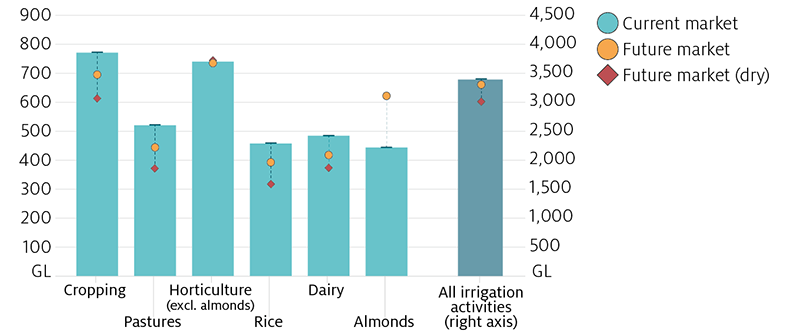
Recently there has been significant concern that during a drought, there would be insufficient water to meet the demand from horticultural plantings (fruits, nuts and grapevines), thereby significantly driving up prices. While the results from the Water Trade Model suggest that water supply (including both surface water and other sources such as groundwater) is sufficient to meet annual horticultural demand (based on observed almond plantings in 2018-19) in all scenarios, in practice there remains some risk of supply shortfalls within each water year, particularly if future conditions are drier than modelled or trade constraints are tightened.
Note these results are based on estimates of existing almond plantations and do not consider additional almond plantings in the future. Furthermore, the Water Trade Model relies on annual data and does not provide insights for day to day water trading and irrigation activity.
Variation in water use is particularly pronounced in traditional irrigation sectors
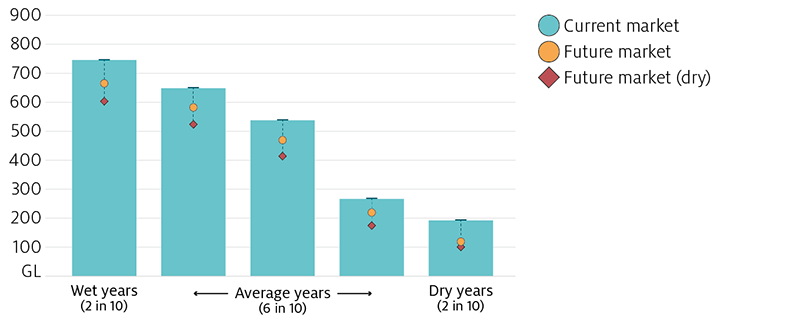
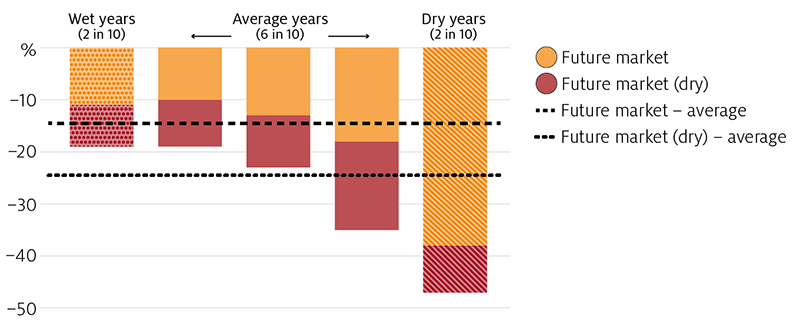
On average, water use in the dairy industry is lower by around 69 GL in the future market scenario and 116 GL in the future market (dry) scenario, compared to the current market scenario (average annual water use of 486 GL). However, dairy water use (and water use in other traditional sectors such as rice) varies considerably depending on seasonal conditions and water prices. Figures 7 and 8 show the distribution of water use in the dairy sector in each scenario, and how it varies across representative ‘wet’ or ‘dry’ years (each occurring in 2 out of 10 years in the future) and ‘average’ years (occurring in 6 out of 10 years in the future).
Traditional irrigation sectors are more sensitive to high prices
During the past decade, irrigated pastures (predominantly used for dairy production in the sMDB) has become an increasingly opportunistic activity, relying on relatively low water prices for profitable returns. A recent survey of dairy farmers in the Goulburn-Murray Irrigation district suggested most (56%) would not consider purchasing water at prices above $200/ML (Dairy Australia 2017). In part, this also reflects the capacity for dairy farmers to use purchased fodder in place of irrigated pastures when water prices are high.
High water prices are more likely in the future
In the future market scenarios, higher water prices are generally more likely, and a greater increase in prices is modelled in dry years compared to the current market scenario. This leads to an overall decrease in water use in the dairy sector, which is particularly pronounced in dry years (as shown in Figure 7 for all modelled scenarios).
However, there is considerable variation in water use in this sector, even in dry years. Dairy water use was modelled to decrease by 38 per cent on average in dry years (Figure 8) in the future market scenario (up to a maximum of 55 per cent in the driest year), compared to the current market scenario. Overall, dairy water use decreases by an average of 14 per cent and 24 per cent in the future market and future market (dry) scenarios respectively, compared to the current market scenario (Figure 8).
The results suggest that the irrigated dairy sector in the southern basin is likely to face continued adjustment pressure in the future. It is important to recognise however, that this analysis does not incorporate responses from farmers that would offset higher water prices (for example, technological change), structural changes in the industry, or future dairy prices.
Inter-regional trade limits will have a larger effect
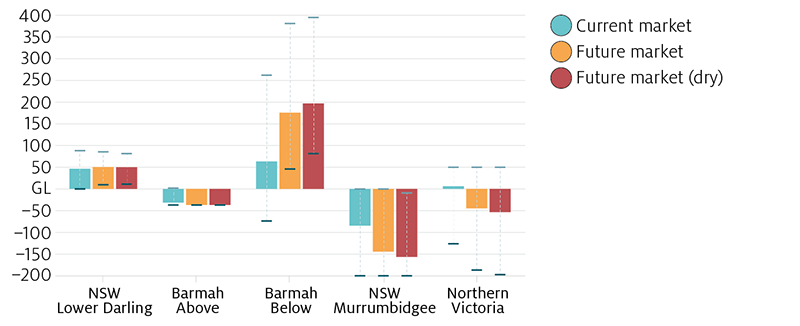
In the ‘future scenarios’, there is a greater reliance on inter-regional trade, which in turn highlights the importance of water markets in facilitating the movement of water to its highest value use, and the role of trade limits in the future. Figure 9 shows the modelled average net trade, as well as the range, for each trading zone (catchments are grouped into trading zones, see note below Figure 9). A general increase in water trading activity is expected across the southern basin in the future.
As discussed previously, most of the increase in future water demand occurs in the almond industry which is primarily located in the Barmah Below trading zone (which includes catchments below the Barmah choke, such as the SA Murray and the Vic. Murray Below). Consequently there is a considerable increase in the volume of water imported into this region, which is primarily sourced from the Murrumbidgee and Northern Victoria.
Source: ABARES
A number of hydrological constraints affect the volume of water that can be traded across the southern basin, and inter-regional trade is regulated by state governments using inter-valley trade limits. While these limits can apply at various times during the water year, an annual limit is approximated using historical data in the Water Trade Model. The model suggests these trade limits are binding more often in the future (Table B3), leading to larger price gaps between catchments above and below the Barmah choke. In particular, the Murrumbidgee reaches the modelled export trade constraint in 8 out of 14 years in the ‘future scenarios’ (Table B3).
As shown in Figure 10, this leads to different distributions for water allocation prices in the Murrumbidgee compared to the Barmah Below in the future. While the price in average years is relatively similar in both trading zones, particularly in dry years, the Murrumbidgee price is typically much lower, reflecting the mix of irrigation activities in the region and a binding trade constraint limiting the volume of water that can be exported (See Table B1 for average water prices by catchment; see Table B3 for number of years where trade limits are binding).
It is important to note that the water market is going through some changes in 2019–20 that have not been considered in the model. In particular, the Goulburn-Murray Inter-valley trade limit is being revised to essentially reduce the volume of water that can be exported from the Goulburn to the Murray.
GVIAP for traditional irrigation sectors will decrease
Table 2 shows the average annual gross value of irrigated agricultural production (GVIAP) across the southern basin by activity. Total GVIAP across all activities increases by 0.8 per cent on average each year in the future market scenario compared to the current market scenario. While this increase is primarily driven by significantly higher almond production, ABARES research also shows that recovering water through on-farm programs leads to greater productivity for participating farms in this scenario. While the average annual GVIAP for most irrigation sectors (except horticulture) is estimated to decline, this decrease would be greater if water was recovered solely through buybacks.
In the future market (dry) scenario, total GVIAP decreases by 4.1 per cent compared to the current market scenario. The positive effect of on-farm programs on farm productivity and greater almond production is more than offset by a decrease in production in other sectors due to lower rainfall and higher water prices.
In both future market scenarios, production (Table B9) for most irrigation activities (except horticulture) decreases, following the changes in irrigated area and water use (Table B4). The average decrease in dairy production is smaller than the average decrease in dairy water use, as farmers are able to substitute water for fodder and maintain a relatively higher level of production. However, for many farms, increased reliance on fodder for dairy production would likely lead to higher input costs and reduced profitability. While this could lead to structural changes in the dairy industry in the longer-term, it is important to note the model does not account for such changes.
| Irrigation activity | Current market ($m) |
Future market ($m) |
Future market (dry) ($m) |
|---|---|---|---|
| Cropping | 441.7 | 413.6 | 366.2 |
| (-6.4%) | (-17.1%) | ||
| Pastures | 457.7 | 420.0 | 364.1 |
| (-8.2%) | (-20.5%) | ||
| Horticulture | 2,435.7 | 2,472.2 | 2,428.5 |
| (1.5%) | (-0.3%) | ||
| Rice | 191.4 | 165.5 | 133.4 |
| (-13.5%) | (-30.3%) | ||
| Dairy | 726.8 | 664.3 | 608.7 |
| (-8.6%) | (-16.2%) | ||
| Almonds | 658.0 | 813.0 | 807.9 |
| (23.5%) | (22.8%) | ||
| All irrigation activities | 4,911.3 | 4,948.7 | 4,708.8 |
| (0.8%) | (-4.1%) | ||
Appendices
This report includes three appendices:
- Appendix A: The Model – pages 20 and 21 in the downloadable version of the report.
- Appendix B: Additional tables – pages 22 to 25 in the downloadable version of the report.
- Appendix C: Future Water recovery – pages 26 and 27 in the downloadable version of the report
References
CSIRO 2008, Water availability in the Murray-Darling Basin, A report to the Australian Government from the CSIRO Murray-Darling Basin Sustainable Yields Project, CSIRO, Canberra.
DA 2019, Progress of water recovery, Department of Agriculture, Canberra.
Dairy Australia 2017, Regional irrigated land and water use mapping in the Goulburn-Murray Irrigation District, Dairy Australia and Murray Dairy.
Gupta, M & Hughes, N 2018, Future scenarios for the southern Murray-Darling Basin water market, Australian Bureau of Agricultural and Resource Economics and Sciences, Canberra.
Gupta, M, Hughes, N, & Wakerman-Powell, K 2018, A model of water trade and irrigation activity in the southern Murray-Darling Basin, Australian Bureau of Agricultural and Resource Economics and Sciences, Canberra.
Hughes, N, Gupta, M & Rathakumar, K 2016, Lessons from the water market: the southern Murray-Darling Basin water allocation market 2000–01 to 2015–16, Australian Bureau of Agricultural Resource Economics and Sciences, Canberra.
