A recent ABARES report noted that the impacts of the 2018 drought on farm incomes may not be as severe as experienced in previous droughts, but that aggregate and average trends would likely mask significant variation in performance across different industries and regions.
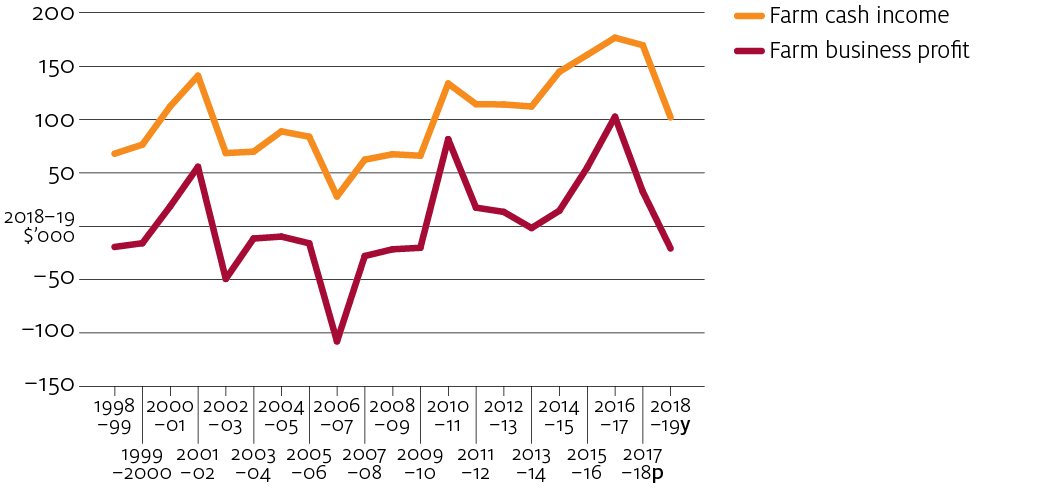
Interim results1 from ABARES annual surveys of broadacre and dairy farms confirm that average farm financial performance in South-Eastern Australia will worsen significantly in 2018-19 relative to the previous year, but not to the levels experienced during the 2002-03 and 2006-07 droughts (figure 1). The impacts of the drought on farm financial performance will be variable however, largely in line with regional differences in the severity of rainfall deficiencies.
Across South-Eastern Australia as a whole, average farm cash income on broadacre farms will decline by nearly $70,000 per farm in 2018-19 (from $169,700 to $102,000), while average farm business profit (farm cash income adjusted for changes in livestock and grain inventories, as well as capital depreciation and the imputed value of family labour) will be the lowest it has been in a decade (figure 1 and table 1).
Figure 1 Real farm cash income and farm business profit, broadacre industries in South-Eastern Australia*, 1998–99 to 2018–19
average per farm

p Preliminary estimate. y Provisional estimate. * South-Eastern Australia is defined as Queensland below 24 degrees latitude, and all of New South Wales, Victoria, and South Australia. Farm cash income is defined as total cash receipts minus total cash costs. It is a short term measure of the cash surplus available to farmers to meet immediate needs. Farm business profit is defined as farm cash income plus the change in trading stocks, less depreciation and the imputed value of the owner–manager, partner(s) and family labour.
Source: ABARES Australian Agricultural and Grazing Industries Survey
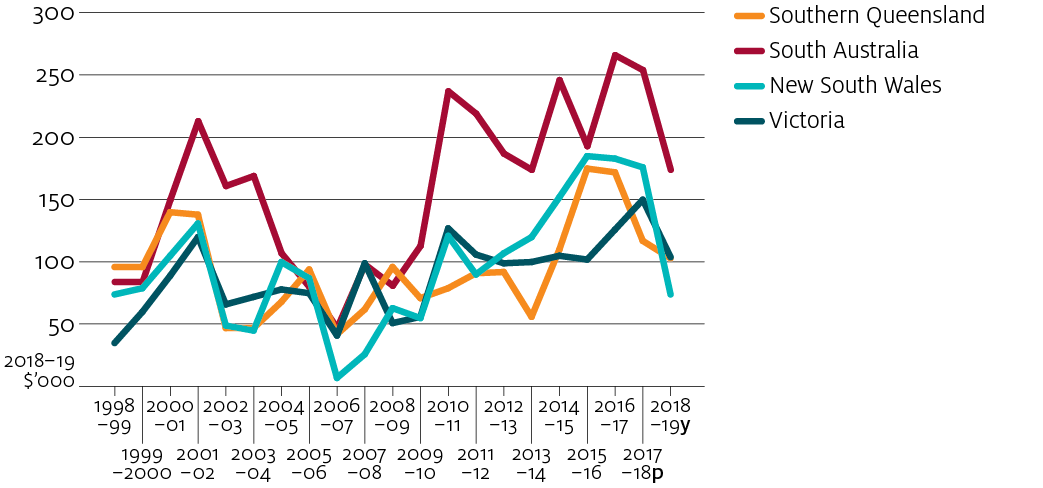
At the state level, average farm cash incomes in 2018-19 are forecast to fall particularly sharply in New South Wales and South Australia, albeit from comparatively high levels in the preceding year (figure 2 and table 1). Within New South Wales, the largest declines are expected in the northern and western parts of the state, where the impact of rainfall deficiencies on farm financial performance have been particularly apparent in 2018-19. The expected decline in average farm cash income in Southern Queensland in 2018-19 is not as large, but it comes on the back of a large decline the previous year.
Figure 2 Real farm cash income in South-Eastern Australia, by State, 1998–99 to 2018–19
average per farm

p Preliminary estimate. y Provisional estimate. * South-Eastern Australia is defined as Queensland below 24 degrees latitude, and all of New South Wales, Victoria, and South Australia. Farm cash income is defined as total cash receipts minus total cash costs.
Source: ABARES Australian Agricultural and Grazing Industries Survey
average per farm
| Farm cash income | Farm business profit a | Farms with negative farm cash income | ||||||||||
|---|---|---|---|---|---|---|---|---|---|---|---|---|
| 2016-17 | 2017-18p | 2018-19y | 2016-17 | 2017-18p | 2018-19y | 2016-17 | 2017-18p | 2018-19y | ||||
| $ | $ | $ | $ | $ | $ | % | % | % | ||||
| All broadacre industries by state | ||||||||||||
| New South Wales | 183,430 | 175,900 | (7) | 74,000 | 108,560 | 5,000 | (282) | -70,000 | 16 | 14 | (32) | 34 |
| Victoria | 125,950 | 150,300 | (8) | 104,000 | 80,010 | 51,900 | (22) | 6,000 | 16 | 16 | (27) | 23 |
| Southern Queensland | 171,910 | 116,600 | (13) | 103,000 | 71,630 | -7,000 | (170) | -18,000 | 12 | 31 | (14) | 35 |
| South Australia | 266,130 | 253,600 | (12) | 174,000 | 167,250 | 114,800 | (21) | 58,000 | 3 | 8 | (44) | 16 |
| South-Eastern Australia | 176,660 | 169,700 | (5) | 102,000 | 102,680 | 32,600 | (24) | -21,000 | 14 | 17 | (14) | 28 |
| South-Eastern Australia by industry | ||||||||||||
| Grains b | 296,460 | 234,900 | (6) | 118,000 | 201,250 | 46,200 | (30) | -34,000 | 11 | 14 | (20) | 29 |
| Sheep | 121,230 | 167,500 | (17) | 123,000 | 61,040 | 48,600 | (46) | 12,000 | 10 | 9 | (41) | 22 |
| Beef | 92,160 | 84,300 | (13) | 60,000 | 30,880 | -3,900 | (287) | -32,000 | 19 | 26 | (23) | 31 |
| Dairy | 83,480 | 156,300 | (13) | 84,000 | -20,480 | 88,500 | (17) | -64,000 | 33 | 15 | (35) | 34 |
a Defined as farm cash income plus the change in trading stocks, less depreciation and the imputed value of operator partner and family labour.
b Grains and Grains-Livestock ANZSICs.
p Preliminary estimates. y Provisional estimates.
Note: Figures in parentheses are standard errors expressed as a percentage of the estimate provided.
[expand all]
Changes in farm inventories
The survey results also show that broadacre farms in South-Eastern Australia are expecting to record only modest reductions in cattle and sheep inventories (numbers on hand) during 2018-19, despite the challenges of drought. This compares with much larger reductions in livestock inventories in 2017-18, particularly in regions where rainfall deficiencies were already quite severe. In 2018-19, favourable prices for beef, sheep meats and wool are encouraging livestock farmers to hold on to remaining cattle and sheep where possible, although high prices for fodder and feed grains are adding to the cost of this strategy.
Broadacre farms in South-Eastern Australia also ran down their grain inventories during the 2017-18 financial year, leaving smaller volumes on hand at the beginning of the 2018-19 season. While grain inventories are forecast to decline further, the absolute size of the reductions are expected to be smaller than those recorded in the previous year.
Given the changes in inventory behaviour, average farm business profit in 2018-19 is not expected to fall by as much as the decline in average farm cash income. Nevertheless, it is still forecast to be negative for the first time in five years, and the lowest in real terms in a decade. In Southern Queensland, average farm business profit will be negative for the second year in a row. (Detailed information about ABARES farm surveys, including variable definitions, can be found on our website.)
Industry-level impacts vary
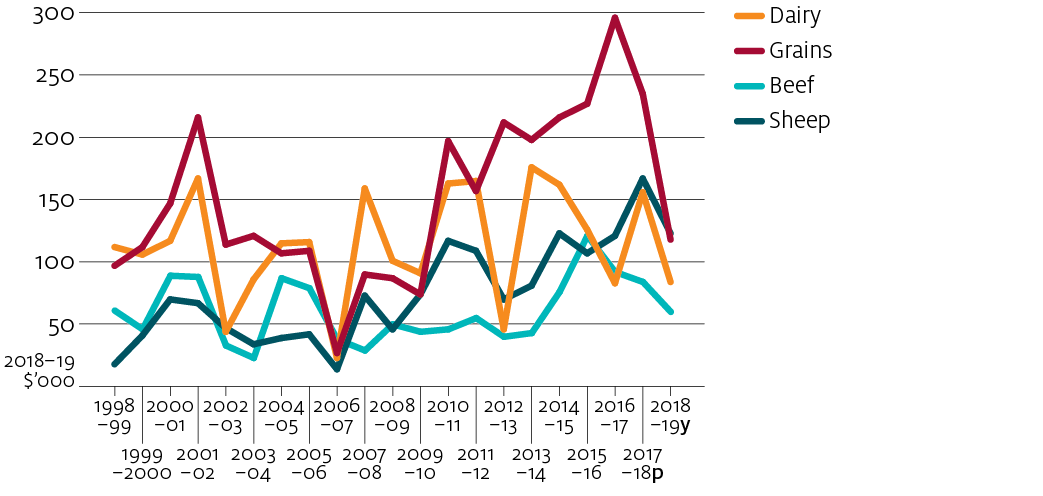
Average farm cash incomes in 2018-19 are expected to fall across all industries in South-Eastern Australia, with the sharpest falls recorded among grain producers and dairy farms (figure 3 and table 1). Farm business profits will also be lower (on average) across all industries in 2018-19, although more so in the case of the dairy industry. Lower milk production, higher fodder costs, and reduced herd sizes mean that average farm business profit for this industry is forecast to fall by over $150,000 per farm in 2018-19 compared with the previous year.
Although sheep specialists have not been spared the impacts of drought, favourable prices for wool and sheep-meat are expected to limit the worst of the effects. The average farm business profit for the sheep industry is expected to be positive in 2018-19, compared with negative results for the beef, grains, and dairy industries.
average per farm

p Preliminary estimate. y Provisional estimate. * South-Eastern Australia is defined as Queensland below 24 degrees latitude, and all of New South Wales, Victoria, and South Australia. Farm cash income is defined as total cash receipts minus total cash costs.
Source: ABARES Australian Agricultural and Grazing Industries Survey
Summer cropping outcomes in 2019 are also important
It is important to note that the final picture for farm incomes in South-Eastern Australia in 2018–19 will depend in part on the success of summer crops in northern New South Wales and southern Queensland. Good outcomes for summer cropping are likely to improve cropping farm incomes in these regions. The improved availability of fodder and feed grains may also benefit livestock producers.
Comprehensive results from ABARES most recent farm surveys will be available at the Outlook 2019 conference in March. They will include estimates of farm financial performance in those parts of Australia that have been less affected by drought, including Western Australia, the Northern Territory and Tasmania.
Download the report
Drought impacts on broadacre and dairy farms in South-Eastern Australia PDF [1.05 MB, 51 pages]
Drought impact data – broadacre and dairy farms South East Australia – preliminary results XLSX [145 KB, 51 pages]
