Key issues
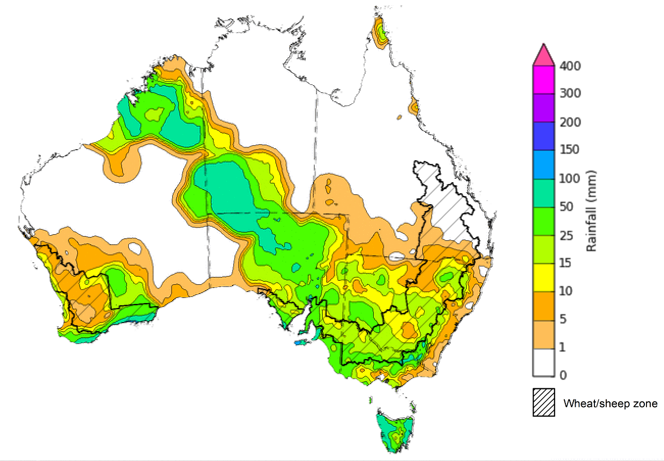
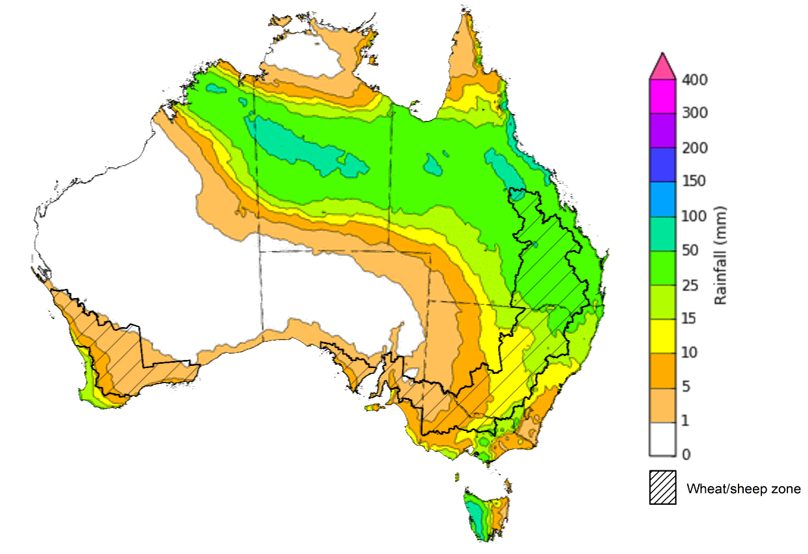
- For the week ending 28 June 2023, a northwest cloud band brought widespread rainfall, extending from northern Western Australia to the southeast of the country. Falls of up to 100 millimetres were recorded in northern Western Australia, southwest Northern Territory and northern South Australia. A front and low-pressure system also crossed southern Australia bringing bring widespread falls up to 100 millimetres to southern Western Australia and South Australia as well as much of New South Wales and Victoria.
- Across cropping regions, rainfall totals of between 10 and 50 millimetres were recorded across much of New South Wales, Victoria and South Australia, and up to 100 millimetres in the parts of eastern Western Australia. This rainfall would have aided the germination and establishment of crops and benefitted soil moisture levels. Dryness and lighter falls of up to 10 millimetres elsewhere would have allowed growers to access fields for post-emergence spraying for pests and disease (see Section 1.1).
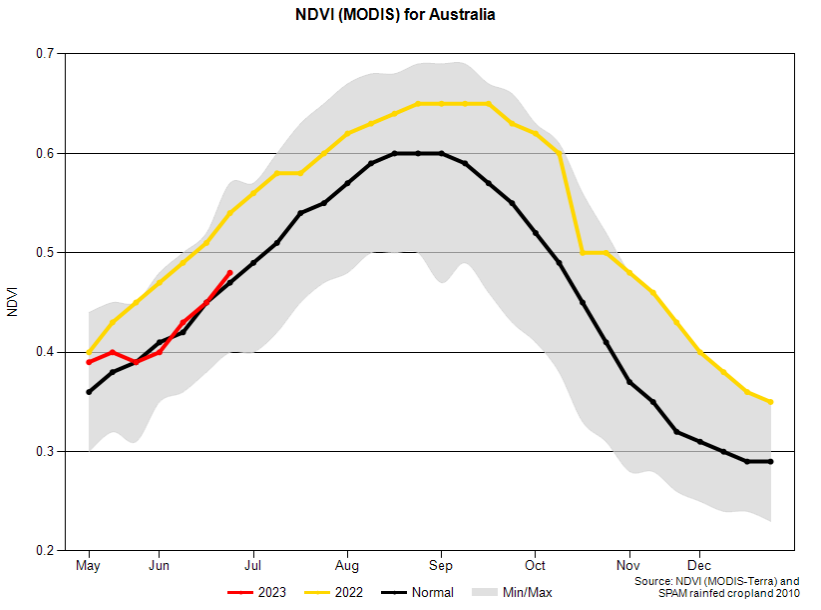
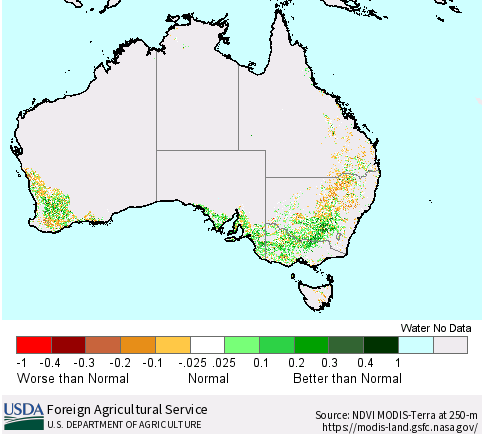
- For the week ending 25 June 2023 vegetation greenness anomaly analysis indicates that plant health is tracking along average for this time of year for Australian croplands as a whole, but considerable variability exists across cropping regions. Vegetation greenness was above normal in southern New South Wales, much of Victoria and South Australia, and in the central parts of Western Australia, reflecting well above average autumn and early winter rainfall in these regions. Vegetation greenness was below normal in central and northern New South Wales, Queensland and parts of southern and northern Western Australia, indicating below average vegetation growth and crop vigour (see Section 1.2).
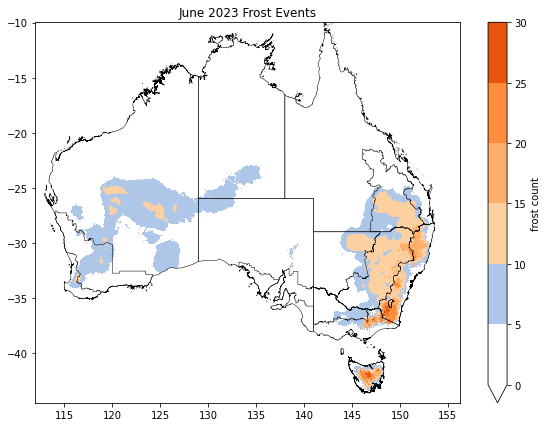
- Between 1 and 27 June 2023, the number of days with minimum temperature below 2°C in the western and eastern Australia for this time of the year was well above average. In central and parts of southwest Western Australia, there has been twice the number of potential frost events with some isolated areas reaching up to 15 days. South-eastern Australia has recorded twice the number of potential frost events and up to 3 times the average number across much of eastern New South Wales and southern Queensland. Central Tasmania also recorded an above average number of frost events throughout June. Cold conditions may have led to crop and pasture damage in the worst affected areas, but due to the early stage of the season there is likely to be adequate time to recover from this early damage if growing conditions remain favourable throughout the remainder of the growing season (see Section 1.3).
- Over the 8-days to 6 July 2023, troughs are expected to generate rain over a broad area stretching from northern Western Australia through the Northern Territory and into southern Queensland. This same system is expected to trigger widespread rain and possible storms in Queensland, potentially extending to northern New South Wales. Onshore winds will bring showers to southern Victoria and western Tasmania. A front will generate showers in the southwest Western Australia (see Section 1.4).
- Across cropping regions, rainfall totals up to 50 millimetres are expected across much of Queensland and northern New South Wales. If realised these falls will provide some relief from the prolonged dry conditions these regions have experienced over the past 5 weeks. Falls up to 15 millimetres are expected across much of central and south-eastern New South Wales and parts of eastern Victoria. If realised, this rainfall should be a boost the soil moisture level and continue to support crop and pasture growth. Little to no rainfall is expected across remaining cropping regions (see Section 1.4).
- Water storage levels in the Murray-Darling Basin (MDB) increased between 22 June 2023 and 29 June 2023 by 78 gigalitres (GL). Current volume of water held in storage is 20 815 GL. This is 2 percent or 466 GL more than at the same time last year.
- Allocation prices in the Victorian Murray below the Barmah Choke increased from $10 on 22 June 2023 to $11 on 29 June 2023.
Climate
For the week ending 28 June 2023, a northwest cloud band brought widespread rainfall, extending from northern Western Australia to the southeast of the country. Falls of up to 100 millimetres were recorded in northern Western Australia, southwest Northern Territory and northern South Australia. A front and low-pressure system also crossed southern Australia bringing bring widespread falls up to 100 millimetres rainfall to southern Western Australia and South Australia as well as much of New South Wales and Victoria.
Across cropping regions, rainfall totals of between 10 and 50 millimetres were recorded across all of Victoria and South Australia and much of New South Wales, and up to 100 millimetres in the parts of eastern Western Australia. This rainfall would have aided the germination and establishment of crops and benefitted soil moisture levels. Dryness and lighter falls of up to 10 millimetres elsewhere would have allowed growers to access fields for post-emergence spraying for pests and disease.
Rainfall for the week ending 28 June 2023
Issued: 28/06/2023 Note: The rainfall analyses and associated maps utilise data contained in the Bureau of Meteorology climate database, the Australian Data Archive for Meteorology (ADAM). The analyses are initially produced automatically from real-time data with limited quality control. They are intended to provide a general overview of rainfall across Australia as quickly as possible after the observations are received. For further information go to http://www.bom.gov.au/climate/rainfall/
For the week ending 25 June 2023 vegetation greenness anomalies analysis indicates that plant health is tracking along average for this time of year for Australian croplands as a whole, but considerable variability exists across growing regions. Vegetation greenness anomalies are based on Normalized Difference Vegetation Index (NDVI) land surface data collected from satellites and shows the level of photosynthetic activity (or greenness) of plants. It can indicate the effectiveness of rainfall for plant growth and can be used to help assess the impacts of seasonal conditions on crop production.
Vegetation greenness anomalies, at 25 June 2023
Spatial analysis of greenness anomalies as at 17 June 2023 indicate that vegetation greenness was variable across cropping regions, reflecting rainfall and soil moisture availability patterns in the recent weeks and months. Vegetation greenness was above normal in southern New South Wales, much of Victoria and South Australia, and in the central parts of Western Australia. This indicates above average vegetation growth and vigour for this time of year—due to well above average autumn and early winter rainfall in these regions. However, vegetation greenness was below normal in central and northern New South Wales, Queensland and parts of southern and northern Western Australia, indicating below average vegetation growth and crop vigour in those areas.
Vegetation greenness anomalies, at 17 June 2023
Frost occurs on clear nights during winter and early spring when the air temperature drops to 2°C or less and is most pronounced in the southern and eastern agricultural regions. The weather events that typically generate damaging frosts is from a passage of cold front, followed by cold southerly winds and a high-pressure ridge. The severity and extent of subsequent damage is variable across the landscape. Crop damage from frost may occur at any stage of development but is most damaging around flowering and grain filling. In June, crops are in early stages of emergence and stem elongation and are less susceptible to permanent frost damage.
However severe frosts (minimum temperatures below -2°C) can cause freezing damage to crop when there is rapid ice crystal formation form within the tissue. The ice crystals physically rupture cell walls and membranes within the cells causing physical damage. Damage can be seen once thawed as dark green water-soaked areas. Ten days after a frost event bleached leaves, stems and reproductive tissue might be evident depending on the growth stage of the crop.
Cold temperatures, when combined with wet and windy conditions can also have severe impacts on lambs and recently shorn animals. It can cause hypothermia when too much heat is lost, or too little body heat is produced. If the cool period is prolonged, a lamb’s capacity to maintain a stable body temperature may be exceeded, resulting in cold stress.
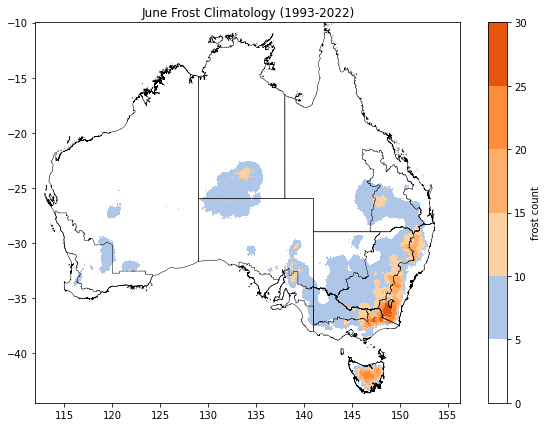
Based on the 30-year (1976-2005) climatology for June, much of the southern Australia records less than 5 days of frosty conditions. Along the alpine regions in the eastern Australia, up to 15 days of frost events can be seen in the central and northern New South Wales, and over 21 days in the southern New South Wales and northern Victoria alpine regions. Central Tasmania records between 6 and 20 days of frost events in June.
Across cropping regions, on average there are up to 5 frost events, except for along the eastern margins of New South Wales and isolated parts of southern and western Queensland where it can experience up to 10 frost events.
Average number of days with minimum temperature below 2°C in June
Between 1 June and 27 June 2023, there has been well above average number of days with minimum temperature below 2°C in the western and eastern Australia for this time of the year. In central and parts of southwest Western Australia, there has been twice the number of potential frost events with some isolated areas reaching up to 15 days of potential frost conditions. Similarly, south-eastern Australia recorded twice the number of potential frost events and up to 3 times the average number of potential frost events across much of eastern New South Wales and southern Queensland. Central Tasmania also recorded an above average number of minimum temperature days below 2°C throughout June.
Across cropping regions, southern Queensland recorded twice the number of potential frost events while central and northern New South Wales recorded up to 3 times the average number of potential frost events compared to the historical average. Analysis indicates that an average number of potential frost events was recorded in Victoria and below average to no potential frost events were recorded across much of South Australia. Average to twice the average number of potential frost events were recorded in Western Australia. A higher-than-average number of days with minimum temperature below 2°C has likely led to some crop and pasture damage in the worst affected areas, but due to the early stage of the season there is likely to be adequate time to recover from this early damage if growing conditions remain favourable throughout the remainder of the growing season. Colder than average temperatures are also likely to have slowed crop and pasture growth and delayed crop establishment leading to decreased ground cover, increasing the risk of evaporation losses and soil erosion risk.
Number of days with minimum temperature below 2°C in June, 2023
Over the 8-days to 6 July 2023, troughs are expected to generate rain over a broad area stretching from northern Western Australia through the Northern Territory and into southern Queensland early in the week. This same system is expected to trigger widespread rain and possible storms in Queensland, potentially extending to northern New South Wales late in the week. Onshore winds will bring showers to southern Victoria and western Tasmania. A front will generate showers in the southwest Western Australia. A high-pressure system will keep elsewhere dry.
Across cropping regions, rainfall totals up to 50 millimetres are expected across much of Queensland and northern New South Wales. If realised these falls will provide some relief from the prolonged dry conditions these regions have experienced over the past 5 weeks. Falls up to 15 millimetres are expected across much of central and south-eastern New South Wales and parts of eastern Victoria. If realised, this rainfall should be a boost to the soil moisture level and continue to support crop and pasture growth. Little to no rainfall is expected across remaining cropping regions.
Total forecast rainfall for the period 29 June 2023 to 6 July 2023
Note: This rainfall forecast is produced from computer models. As the model outputs are not altered by weather forecasters, it is important to check local forecasts and warnings issued by the Bureau of Meteorology.
Water
Water storages, water markets and water allocations - current week
The Tableau dashboard may not meet accessibility requirements. For information about the contents of these dashboards contact ABARES.
Commodities
Information on weekly price changes in agricultural commodities is now available at the Weekly commodity price update.

