
Key issues
- In the week ending 2 October 2024, a series of cold fronts and low-pressure systems brought rainfall to large areas of north-western and parts of south-eastern Australia, with other areas largely dry.
- Across cropping regions, little to no rainfall was recorded across most areas this week.
- In areas where stored soil moisture has declined to low levels across parts of south-eastern and south-western Australia, little to no rainfall has likely led to continued reductions in yield potential, exacerbated by severe frosts in recent weeks.
- Over coming days, low-pressure and frontal systems are expected to bring showers and storms to parts of western, eastern and southern Australia. High-pressure systems are expected to keep remaining areas largely dry.
- Across cropping regions, some rainfall is expected across southern growing regions. Rainfall totals of between 5 and 25 millimetres are expected in Victoria, South Australia, southern New South Wales, and parts of Western Australia and Queensland.
- If realised, these falls across southern Australia may be sufficient to stabilise winter crop yields across some growing regions. However, in parts of south-eastern and south-western Australia these falls will likely be insufficient to prevent further declines in crop yields compared to those expected at the end of August, following very dry conditions during September and recent severe frost events.
- Nationally, September rainfall was high in the north-west and parts of eastern Australia. Very much below average rainfall was recorded across large areas of southern Australia.
- Soil moisture models suggest low soil moisture in south-eastern Australia, with above average soil moisture modelled in eastern Queensland, northern New South Wales, and large parts of Western Australia and the Northern Territory.
- For the 3 months to September 2024, above average rainfall totals resulted in average to extremely high pasture production across large parts of eastern, western, and central Australia. Below average to extremely low pasture growth was recorded in some southern areas and isolated regions in the east.
- Water storage levels in the Murray-Darling Basin (MDB) decreased between 26 September 2024 and 2 October 2024 by 148 gigalitres (GL). Current volume of water held in storage is 17 779 GL, equivalent to 80% of total storage capacity. This is 12 percent or 2,784GL less than at the same time last year.
- Allocation prices in the Victorian Murray below the Barmah Choke decreased from $147 on 26 September 2024 to $143 on 3 October 2024. Prices are lower in the Murrumbidgee due to the binding of the Murrumbidgee export limit.
Climate
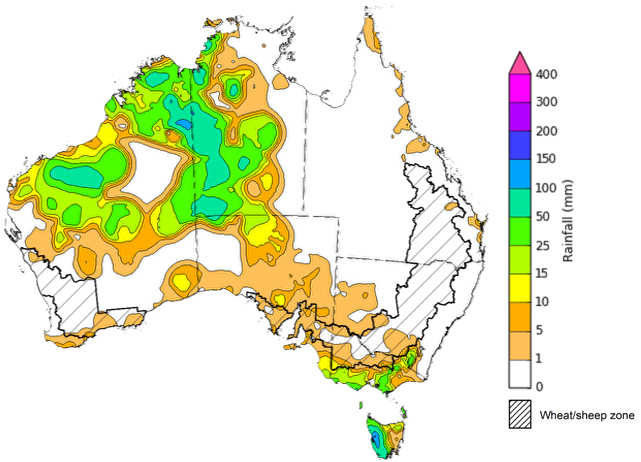
For the week ending 2 October 2024, a series of cold fronts moved through south-eastern Australia, bringing showers and isolated thunderstorms. Meanwhile, an upper-level trough, combined with tropical moisture, triggered several days of widespread rainfall and isolated thunderstorms across the north of Western Australia and western parts of the Northern Territory. Rainfall totals of up to 50 millimetres were recorded across parts of southern New South Wales, Victoria and South Australia. Heavier fall of up to 150 millimetres were recorded across large areas of northern Western Australia and the west of the Northen Territory. In Tasmania, cold fronts brought rainfall totals of up to 150 millimetres in the west. High pressure systems saw much of the remainder of the country record little to no rainfall.
Across cropping regions, little to no rainfall was recorded across most areas this week. Isolated areas of southern New South Wales, Victoria, South Australia and southern Western Australia recorded rainfall totals of between 1 and 5 millimetres. These falls are significantly less then what was forecast for the week, and as such reducing the yield potential of winter crops across most southern growing regions has likely continued in the past week.
In regions where average levels of stored soil moisture were available, crops and pastures would have been able to draw on these reserves to maintain current yield potentials. However, in areas where stored soil moisture levels are low, little to no rainfall has likely to lead to reduced yield potential, exacerbated by severe frosts and windy conditions across some areas in recent weeks.
Rainfall for the week ending 2 October 2024
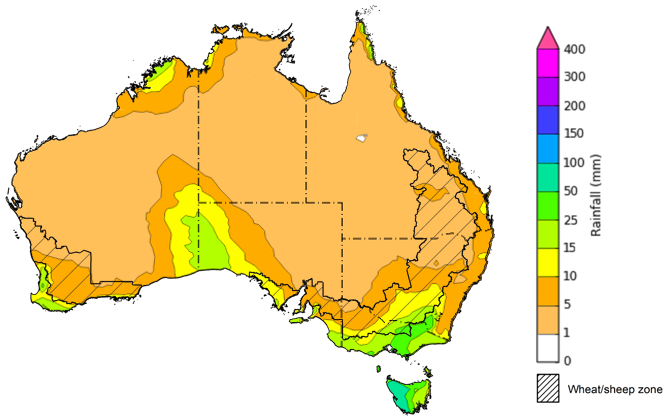
Over the 8 days to 10 October 2024, low-pressure and frontal systems are expected to bring showers and storms over parts of western, southern and eastern Australia. Up to 50 millimetres is forecast for Victoria, southern and eastern New South Wales and south-west Western Australia. Falls of between 5 and 25 millimetres expected across parts of south-eastern Queensland, western and southern South Australia, parts of eastern and northern Western Australia and isolated areas of tropical northern Australia. Rainfall totals of between 15 and 100 millimetres are forecast for Tasmania. High pressure systems are expected to keep much of north-eastern and central Australia largely dry.
Across cropping regions, some rainfall is expected across southern growing regions. Rainfall totals of between 5 and 25 millimetres are expected in Victoria and southern New South Wales, with falls of between 5 and 15 millimetres expected in South Australia, southern Western Australia and parts of northern Queensland.
If realised, these falls across southern Australia may be sufficient to stabilise winter crop yields across some growing regions. However, in parts of south-eastern and south-western Australia these falls will likely be insufficient to prevent further declines in crop yields compared to those expected at the end of August, following very dry conditions during September and recent severe frost events.
Total forecast rainfall for the period 3 October to 10 October 2024
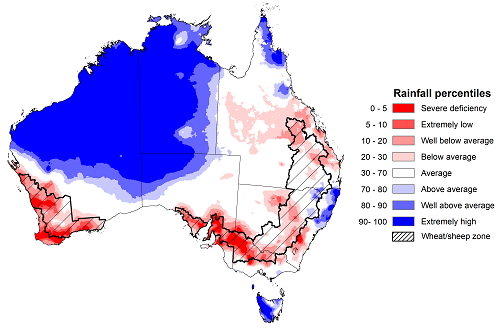
During September 2024, rainfall was well above average to extremely high across large parts of Tasmania, northern and central Western Australia, the Northern Territory, north-western South Australia, and the north-east of New South Wales and Queensland. In contrast, much of northern Victoria, large areas of southern South Australia, central and southern New South Wales, central Queensland and the south-west of Western Australia recorded extremely low to below average rainfall. The remainder of Australia saw generally average September rainfall.
In cropping regions, September 2024 rainfall was highly variable, with much of southern Queensland and northern New South Wales experiencing average to above average rainfall. In contrast, much of Victoria, South Australia, Western Australia, central and southern New South Wales and northern Queensland recorded severely deficient to below average rainfall.
Following below average to average rainfall in previous month across much of Victoria and South Australia, extremely low September rainfall totals have likely led to widespread moisture stress and significant declines in winter crop yields. Similarly. a lack of finishing rains in September across much of Western Australia and parts of southern New South Wales, combined with the warm sunny days, has seen crops drawing down residual sub-soil moisture. However, moisture reserves are lower this year due to below average growing season rainfall, this may have led to some declines in yield potential in these areas. By contrast, the average to above average rainfall totals recorded across southern Queensland and northern New South Wales, has assisted in maintaining soil moisture levels and supported the crop development and average to above average yield expectations.
Rainfall percentiles for September 2024
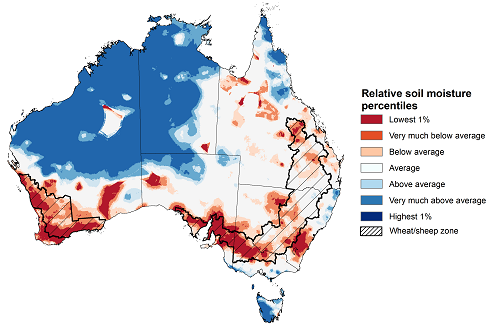
While modelled upper layer soil moisture levels for September 2024 varied considerably, much of the country saw average to very much above average soil moisture. High levels of upper layer soil moisture were modelled across large parts of northern and central Western Australia, the Northern Territory, northern South Australia and Tasmania. In contrast, upper layer soil moisture was modelled to be very much below average across much of northern Victoria, southern South Australia, south-western Western Australia, and parts of southern and central New South Wales and Queensland.
At this time of year, upper layer soil moisture is less critical for well-established winter crops. However, upper layer soil moisture will be critical for supporting the germination and establishment of summer crops in the coming months.
Across cropping regions, upper layer soil moisture in September was modelled to be generally average across southern Queensland and northern New South Wales. Remaining parts of Queensland and New South Wales were modelled to have very much below average to below above average soil moisture. Much of Victoria, South Australia and Western Australia were modelled to have extremely low to very much below average upper layer soil moisture. Timely rainfall in the coming weeks will be critical to support the development and arrest sliding yield prospects of winter crops across southern growing regions and boost upper lower soil moisture for the planting of summer crops in northern growing regions.
Modelled upper layer soil moisture for September 2024
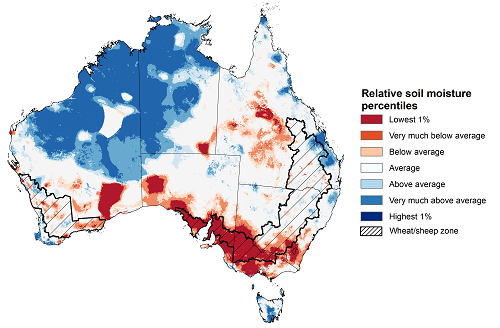
Across northern and central Australia, lower layer soil moisture was average to very much above average, with northern Western Australia, western Northern Territory and scattered parts of eastern Queensland seeing the highest moisture on record levels for this time of year. In contrast, large areas of southern Australia and central Queensland were modelled to have extremely low to below average lower layer soil moisture.
Lower layer soil moisture plays a pivotal role in sustaining the growth of winter crops and pasture during their critical development stages.
Across cropping regions, lower layer soil moisture generally ranged from average to above average in the east, with Queensland and much of New South Wales showing average to well above average soil moisture. In Western Australia, soil moisture was modelled to be average to below average in the eastern and central areas, and above average in the north-west. In South Australia, Victoria, and southern New South Wales, September lower layer soil moisture was modelled to be extremely low to below average for this time of year. Cropping regions in far south-eastern Australia with extremely low levels of stored soil moisture will require sufficient and timely rainfall the remainder of spring to arrest declining levels of crop and pasture production.
Modelled lower layer soil moisture for September 2024
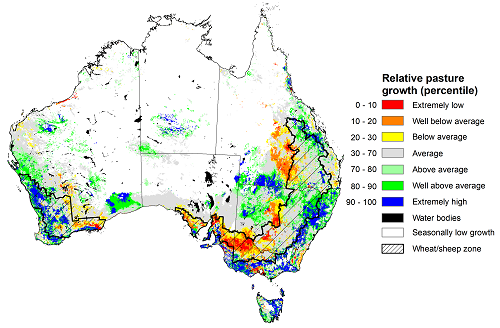
During the northern Australia dry season (May to September), pasture growth typically declines significantly due to the reduction in water availability, with livestock relying on pasture grown throughout the previous wet season. Across southern Australia, July to September pasture growth influences the number of livestock than can be supported without supplementary feeding over winter and the level of reliance on hay and grain during this period. Pasture availability during this period influences the growth and branding and marking rates of lambs and calves, livestock turnoff and the production of meat, milk, and wool.
For the 3 months to September 2024, average to extremely high pasture growth relative to this time of year was modelled across much of New South Wales, southern Victoria, large areas of Queensland, eastern Tasmania, much of Western Australia, southern Northern Territory and in scattered areas of South Australia. This growth is likely to enable farmers to continue to maintain stock numbers and provide opportunities to build standing dry matter availability and replenish fodder supplies during spring.
In contrast, below average to extremely low pasture growth rates were recorded across the south and east of the country. Large areas of southern South Australia and northern Victoria, central parts of Queensland and central New South Wales and parts of southern Western Australia, all saw below average to well below average pasture growth. Graziers in regions where below average pasture growth was recorded will be more reliant on supplemental feed to maintain current stocking rates and production.
Relative pasture growth for 3-months ending September 2024 (1 July to 31 September 2024)
Water
Water storages, water markets and water allocations - current week
The Tableau dashboard may not meet accessibility requirements. For information about the contents of these dashboards contact ABARES.

Commodities
Information on weekly price changes in agricultural commodities is now available at the Weekly commodity price update.