The complete Executive summary from Australia's State of the Forests Report 2018 is available as an accessible PDF [8.3 MB], with the data available at Executive summary – Data.
Australia’s State of the Forests Report 2018 is the fifth in a series of national five-yearly reports on Australia’s forests, and covers a range of social, economic and environmental values. Previous national SOFR reports were published in 1998, 2003, 2008 and 2013.
Australia's State of the Forests Report 2018 – Executive summary draws together the material presented in SOFR 2018 into nine key themes.
This page provides content extracted from the Executive summary and organised under these nine themes.
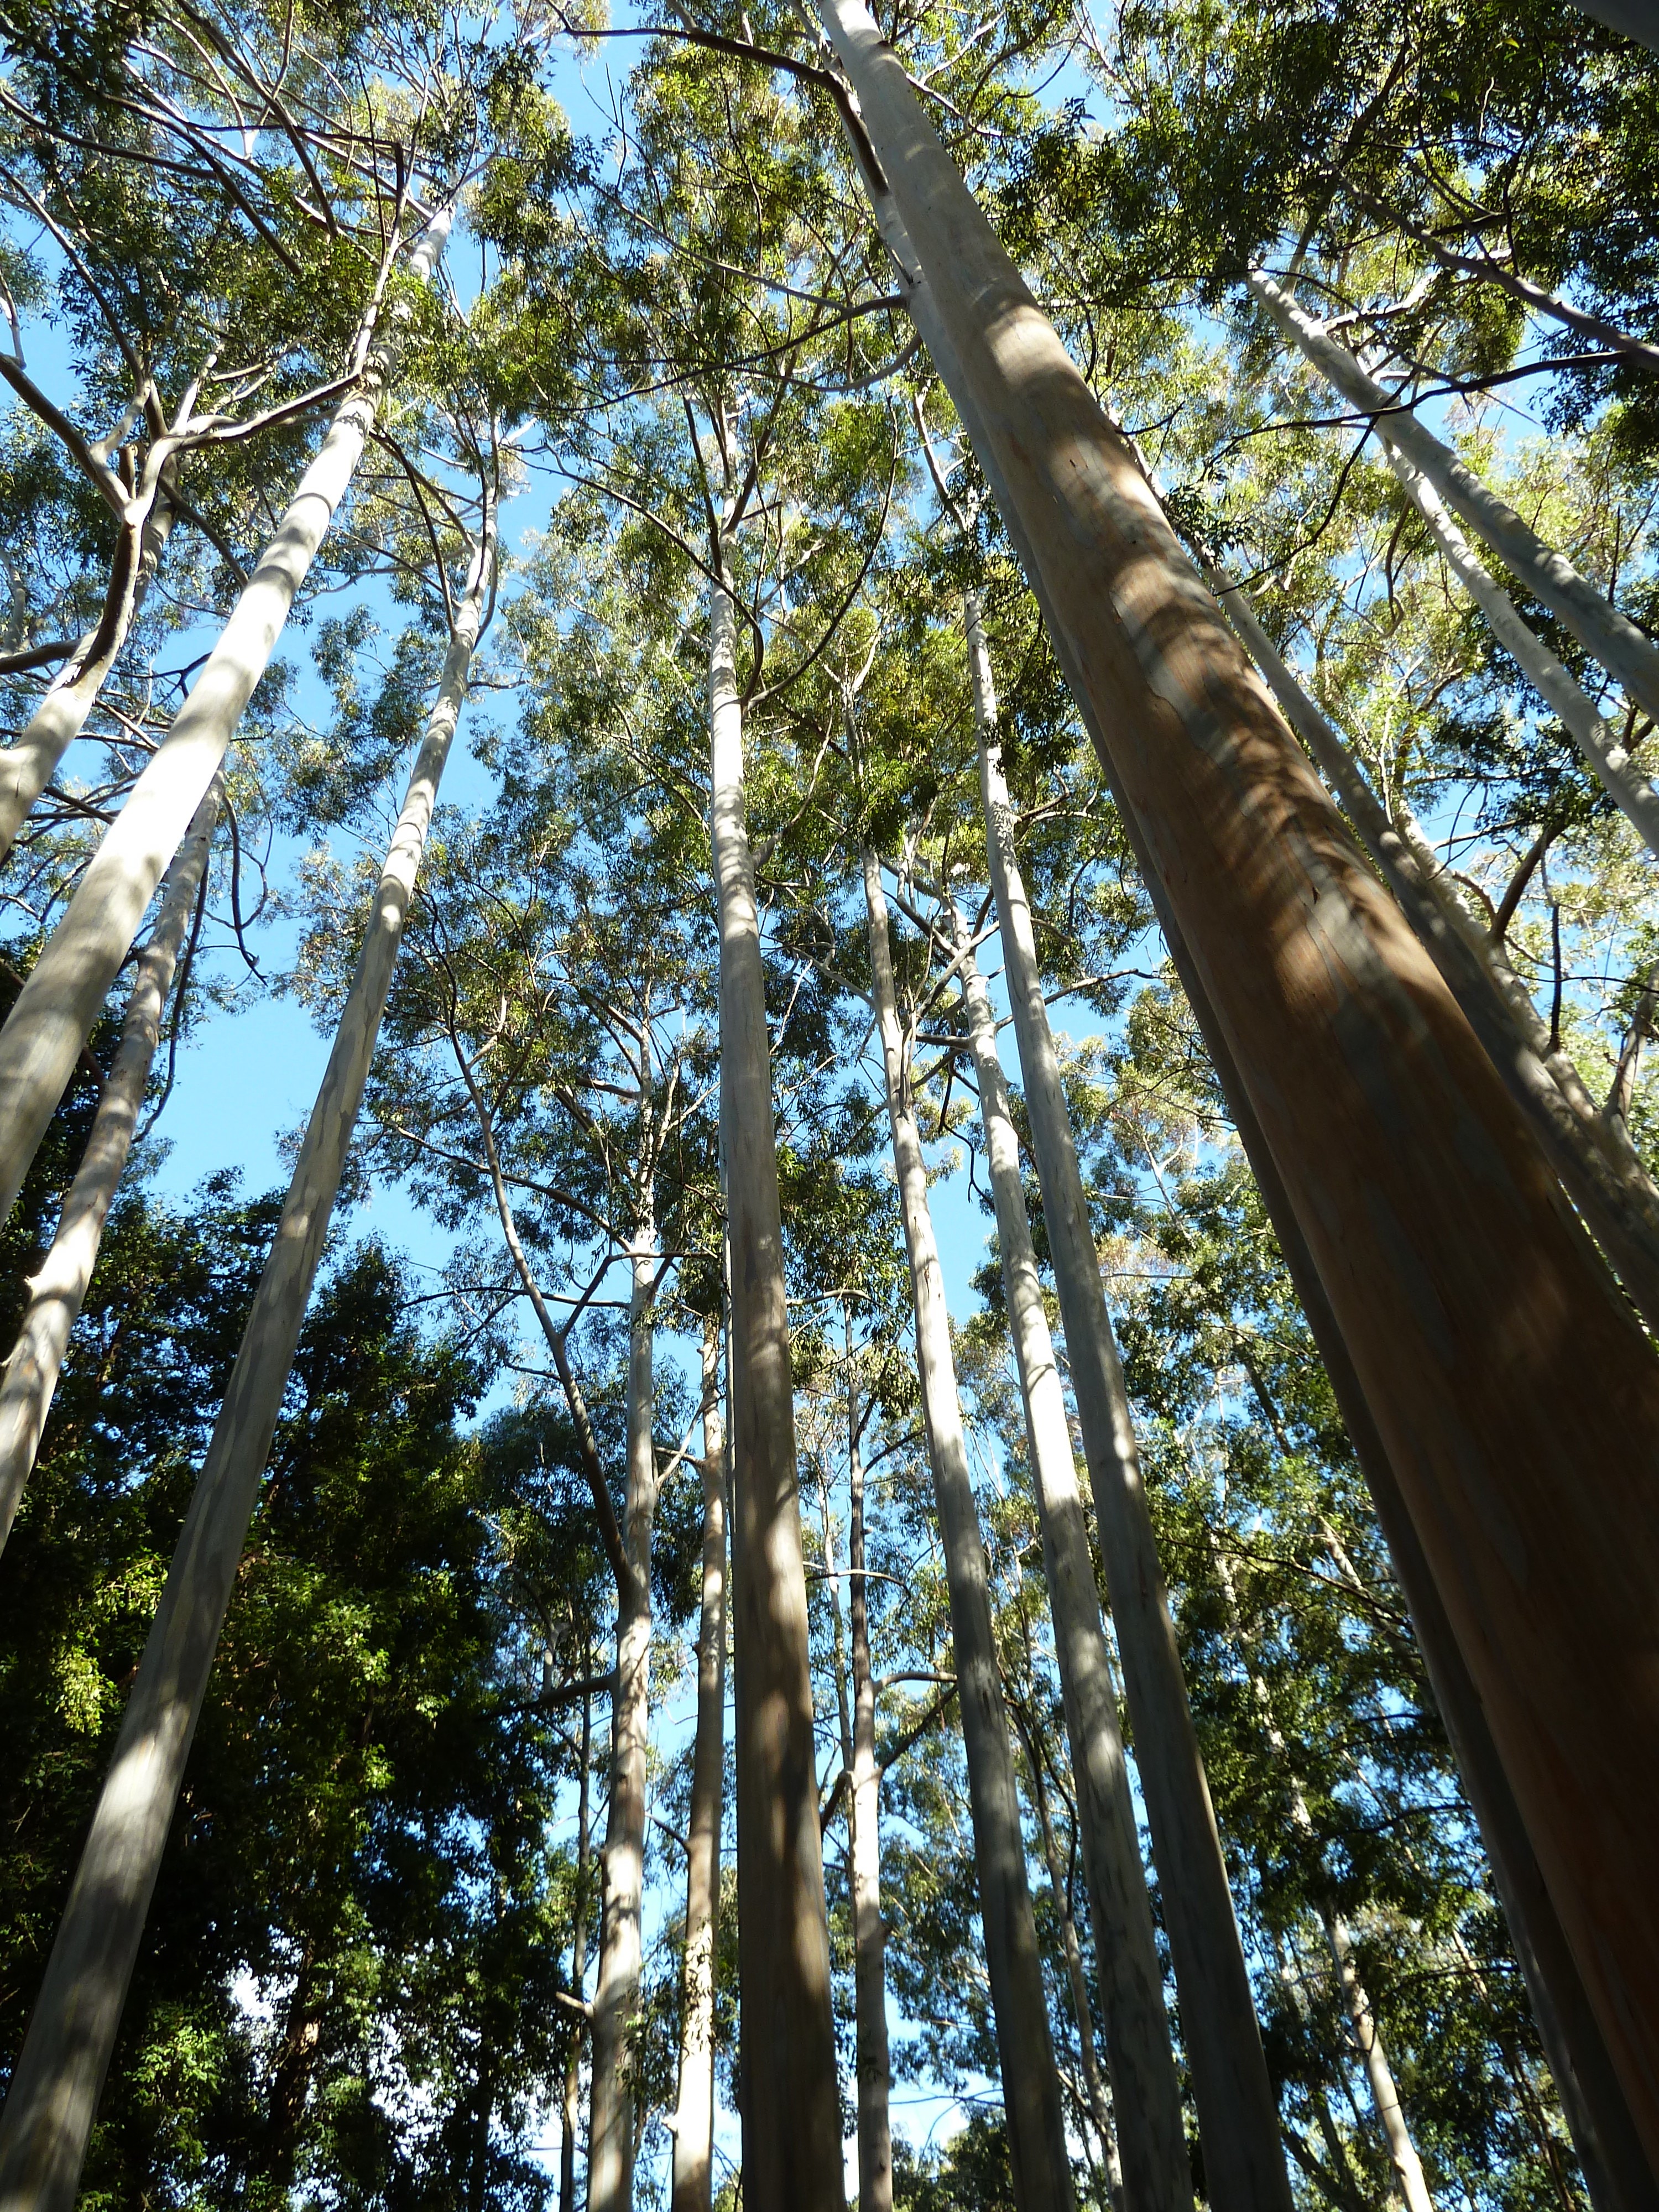
Photo: Eucalyptus saligna, Willowdale, Arboretum. Source: Mark Parsons.
Australia’s forests are recognised and valued for their diverse ecosystems and unique biodiversity; for their cultural heritage; for their provision of goods and services such as wood, carbon sequestration and storage, and soil and water protection; and for their aesthetic values and recreational opportunities.
At the same time, Australia’s forests are subject to a range of pressures, including extreme weather events, drought and climate change; invasive weeds, pests and diseases; changed fire regimes; clearing for urban development, mining, infrastructure or agriculture; and the legacy of previous land-management practices.
The sustainable management and conservation of Australia’s forests, whether on public or on private land, requires a sound understanding of their extent, type, use and management. Australia’s State of the Forests Report 2018 (SOFR 2018) provides comprehensive information from a wide range of sources that can contribute to a better understanding of the broad range of values relating to Australia’s forests and their current management.
The information presented in SOFR 2018 covers primarily the five-year period from 2011 to 2016, or otherwise using the best available data. The report is organised under a framework of seven criteria for sustainable forest management developed by the international-level Montreal Process Working Group on Criteria and Indicators for the Conservation and Sustainable Management of Temperate and Boreal Forests, and then under 44 separate indicators. This Executive summary draws together data from the material presented under these 44 indicators into a number of key themes.
For further information on Australia's forests and SOFR 2018, see the Introduction to Australia's State of the Forests Report 2018.

A downloadable higher resolution version of this map is available here.
The area, type, tenure and management category of forests provides the base data for describing the state of Australia’s forests, and changes over time.
Australia has 134 million hectares of forest as at 2016, covering 17% of Australia’s land area. Australia has approximately 3% of the world’s forests, and globally is the country with the seventh largest forest area.
Australia’s forests can be divided into three categories: 132 million hectares of ‘Native forest’, 1.95 million hectares of ‘Commercial plantations’, and 0.47 million hectares of ‘Other forest’.

This figure and the data used to create it are available in Microsoft Excel [287 KB].
Queensland has the largest area of forest (39% of Australia's forest), with the Northern Territory (18%), Western Australia (16%), and New South Wales (15%), making up much of the balance.
Native forests are dominated by eucalypt forests (101 million hectares) and acacia forests (11 million hectares).
The majority of native forests (91 million hectares) are woodland forests, which have a canopy cover between 20% and 50%. By ownership, most of Australia’s native forests (88 million hectares) are in private and leasehold tenures. The area of native forest in formal nature conservation reserves is 22 million hectares, and the area of multiple-use public native forests is 10 million hectares.

A downloadable higher resolution version of this map is available here.
The Indigenous forest estate is the area of forest over which Indigenous peoples and communities have ownership, management or special rights of access or use.
The Indigenous forest estate is a total of 70 million hectares of forest (52% of Australia’s forests), almost all of which is native forest. This area includes areas of land over which Indigenous people have ‘Other special rights’, including through native title determinations and Indigenous Land Use Agreements. The term ‘Indigenous’ is used throughout the SOFR series to encompass all Aboriginal and Torres Strait Islander peoples.
Australia’s forest area has increased progressively since 2008. The net increase in forest area over the period 2011 to 2016 was 3.9 million hectares.
This increase in forest area is due to the net effect of forest clearing or reclearing for agricultural use; regrowth of forest on areas previously cleared for agricultural use; expansion of forest onto areas not recently containing forest; establishment of environmental plantings; and changes in the commercial plantation estate. In each year of the period 2011–2016, the area of forest cleared or recleared was less than the area of forest regrowing from previous clearing.
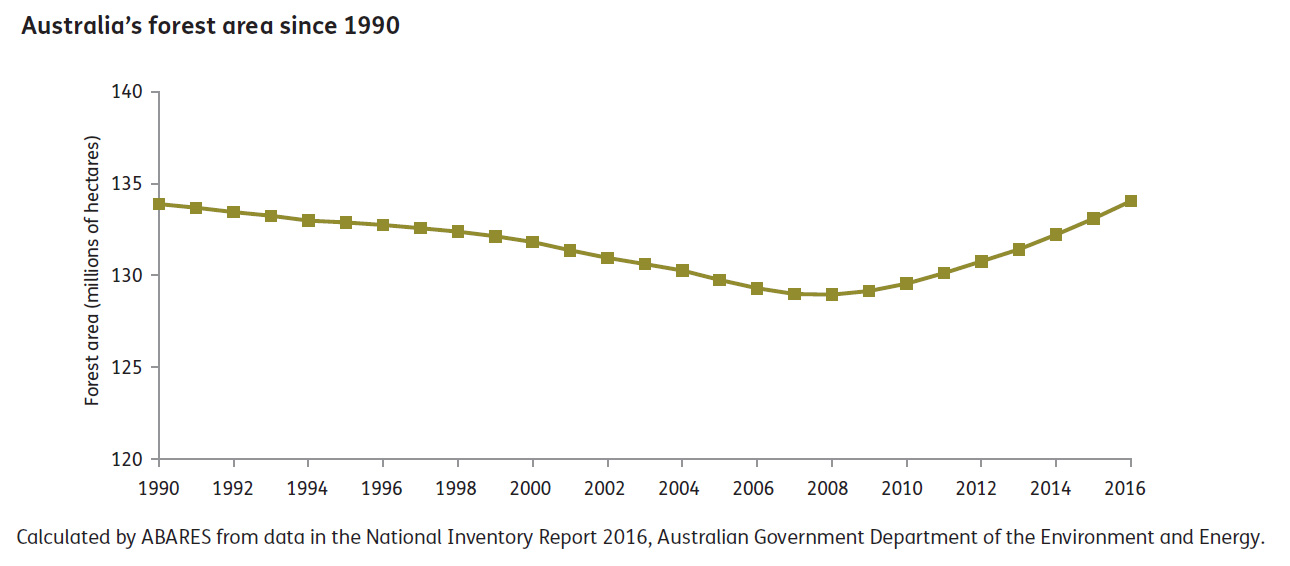
This figure and the data used to create it are available in Microsoft Excel [287 KB].
The forest area dataset prepared for SOFR 2018 combines data from a wide range of different datasets, assembled using a Multiple Lines of Evidence methodology.
SOFR 2013 reported a total forest area of 125 million hectares as at 2011, compared to the 134 million hectares of forest reported in SOFR 2018 as at 2016. Most of this difference in the understanding of Australia’s forest extent derives from use of more accurate state, territory and national datasets and recent high-resolution imagery, not from actual on-ground changes in forest area.
For further information on Australia's forest area, see Indicator 1.1a, Indicator 6.4a and Indicator 7.1d of Australia’s State of the Forests Report 2018.
In Australia, substantial emphasis is placed on the management of forest ecosystems for the conservation of biodiversity, including through the creation of reserves, development of management prescriptions, and identification and listing of threatened species.
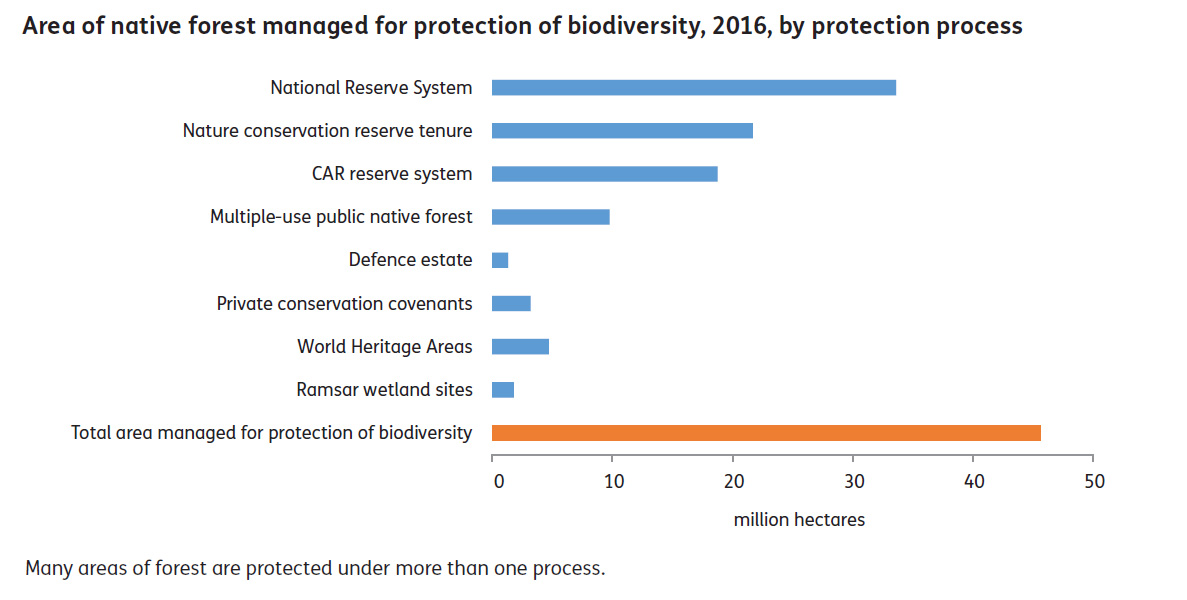
This figure and the data used to create it are available in Microsoft Excel [287 KB].
A total of 46 million hectares (35%) of Australia’s native forest is on land protected for biodiversity conservation, or where biodiversity conservation is a specified management intent.
This area is the result of a range of formal and informal processes on both public and private land that are used to protect areas of forest for the conservation of biodiversity.
Part of this area is contributed by Australia’s National Reserve System, which includes 34 million hectares of forest (26% of Australia’s native forests).
Australia’s national lists of forest-dwelling species (species that use forests for part of their lifecycle) include 2,486 forest-dwelling native vertebrate fauna species (animals), and 16,836 forest-dwelling native vascular flora species (plants).
Of the forest-dwelling native vertebrate fauna species, 1,119 have been identified as forest-dependent species (species that require forest habitat for part of their lifecycle and could not survive or reproduce without it).
A total of 1,420 forest-dwelling fauna and flora species are listed as threatened species under the Commonwealth Environment Protection and Biodiversity Conservation Act 1999.
Of the listed threatened forest-dwelling fauna and flora species, 842 species are forest-dependent.
The most common threats to nationally listed forest-dwelling fauna and flora include forest loss from clearing for agriculture and urban and industrial development; impacts of predators; small population sizes; and unsuitable fire regimes.

A downloadable higher resolution version of this map is available here.
Based on the emphasis given in listing advice documents in regard to their impacts, forestry operations pose a less significant threat to nationally listed forest-dwelling fauna and flora species compared with other threat categories.
During the period 2011–16, a total of 68 forest-dwelling species were added to the national list of threatened species, and 77 forest-dwelling species were removed.
Most additions were based on inherently small population sizes and/or ongoing impacts on habitat extent and quality, including impacts of introduced species and unsuitable fire regimes.
For further information on Australia's forest biodiversity, see Indicator 1.1c, Indicators 1.2a–c and Indicators 1.3a–b of Australia’s State of the Forests Report 2018.
Australia’s forests provide a range of ecosystem services in regards to biodiversity, carbon, soil and water. The extent to which these ecosystem services are delivered varies with forest growth stage, with the degree of fragmentation of the forest area, and as a result of the impacts of fire, climatic conditions, and pests and diseases.
Australia’s native forests comprise stands at regeneration, regrowth, mature and senescent growth stages, as well as stands of uneven-aged forest.
Old-growth forest is not a specific growth stage, but is defined in relation to stand structure, as ‘ecologically mature forest where the effects of disturbance are now negligible’.
The area of old-growth forest in Regional Forest Agreement regions is calculated to have decreased by 0.5 million hectares between the signing of Regional Forest Agreements and 2016.
The majority of this decrease occurred in Victoria, almost entirely due to bushfires in the decade to 2009.
The majority of Australia’s native forest is continuous, not fragmented.
At the 1-hectare scale, 72% of Australia’s native forest area is comprised of areas that are completely bounded by forest.
A total of 68% of Australia’s native forest is in patches of over 100 thousand hectares.
The most fragmented forests occur in drier regions where woodland forest naturally borders areas of vegetation with lower tree canopy cover, as well as in areas with higher impacts from historical land clearing for agriculture and from urban development.
The total area of forest in Australia burnt one or more times during the period 2011–12 to 2015–16 was 55 million hectares (41% of Australia’s total forest area). Areas that burnt more than once during this period were more likely to be in northern Australia.
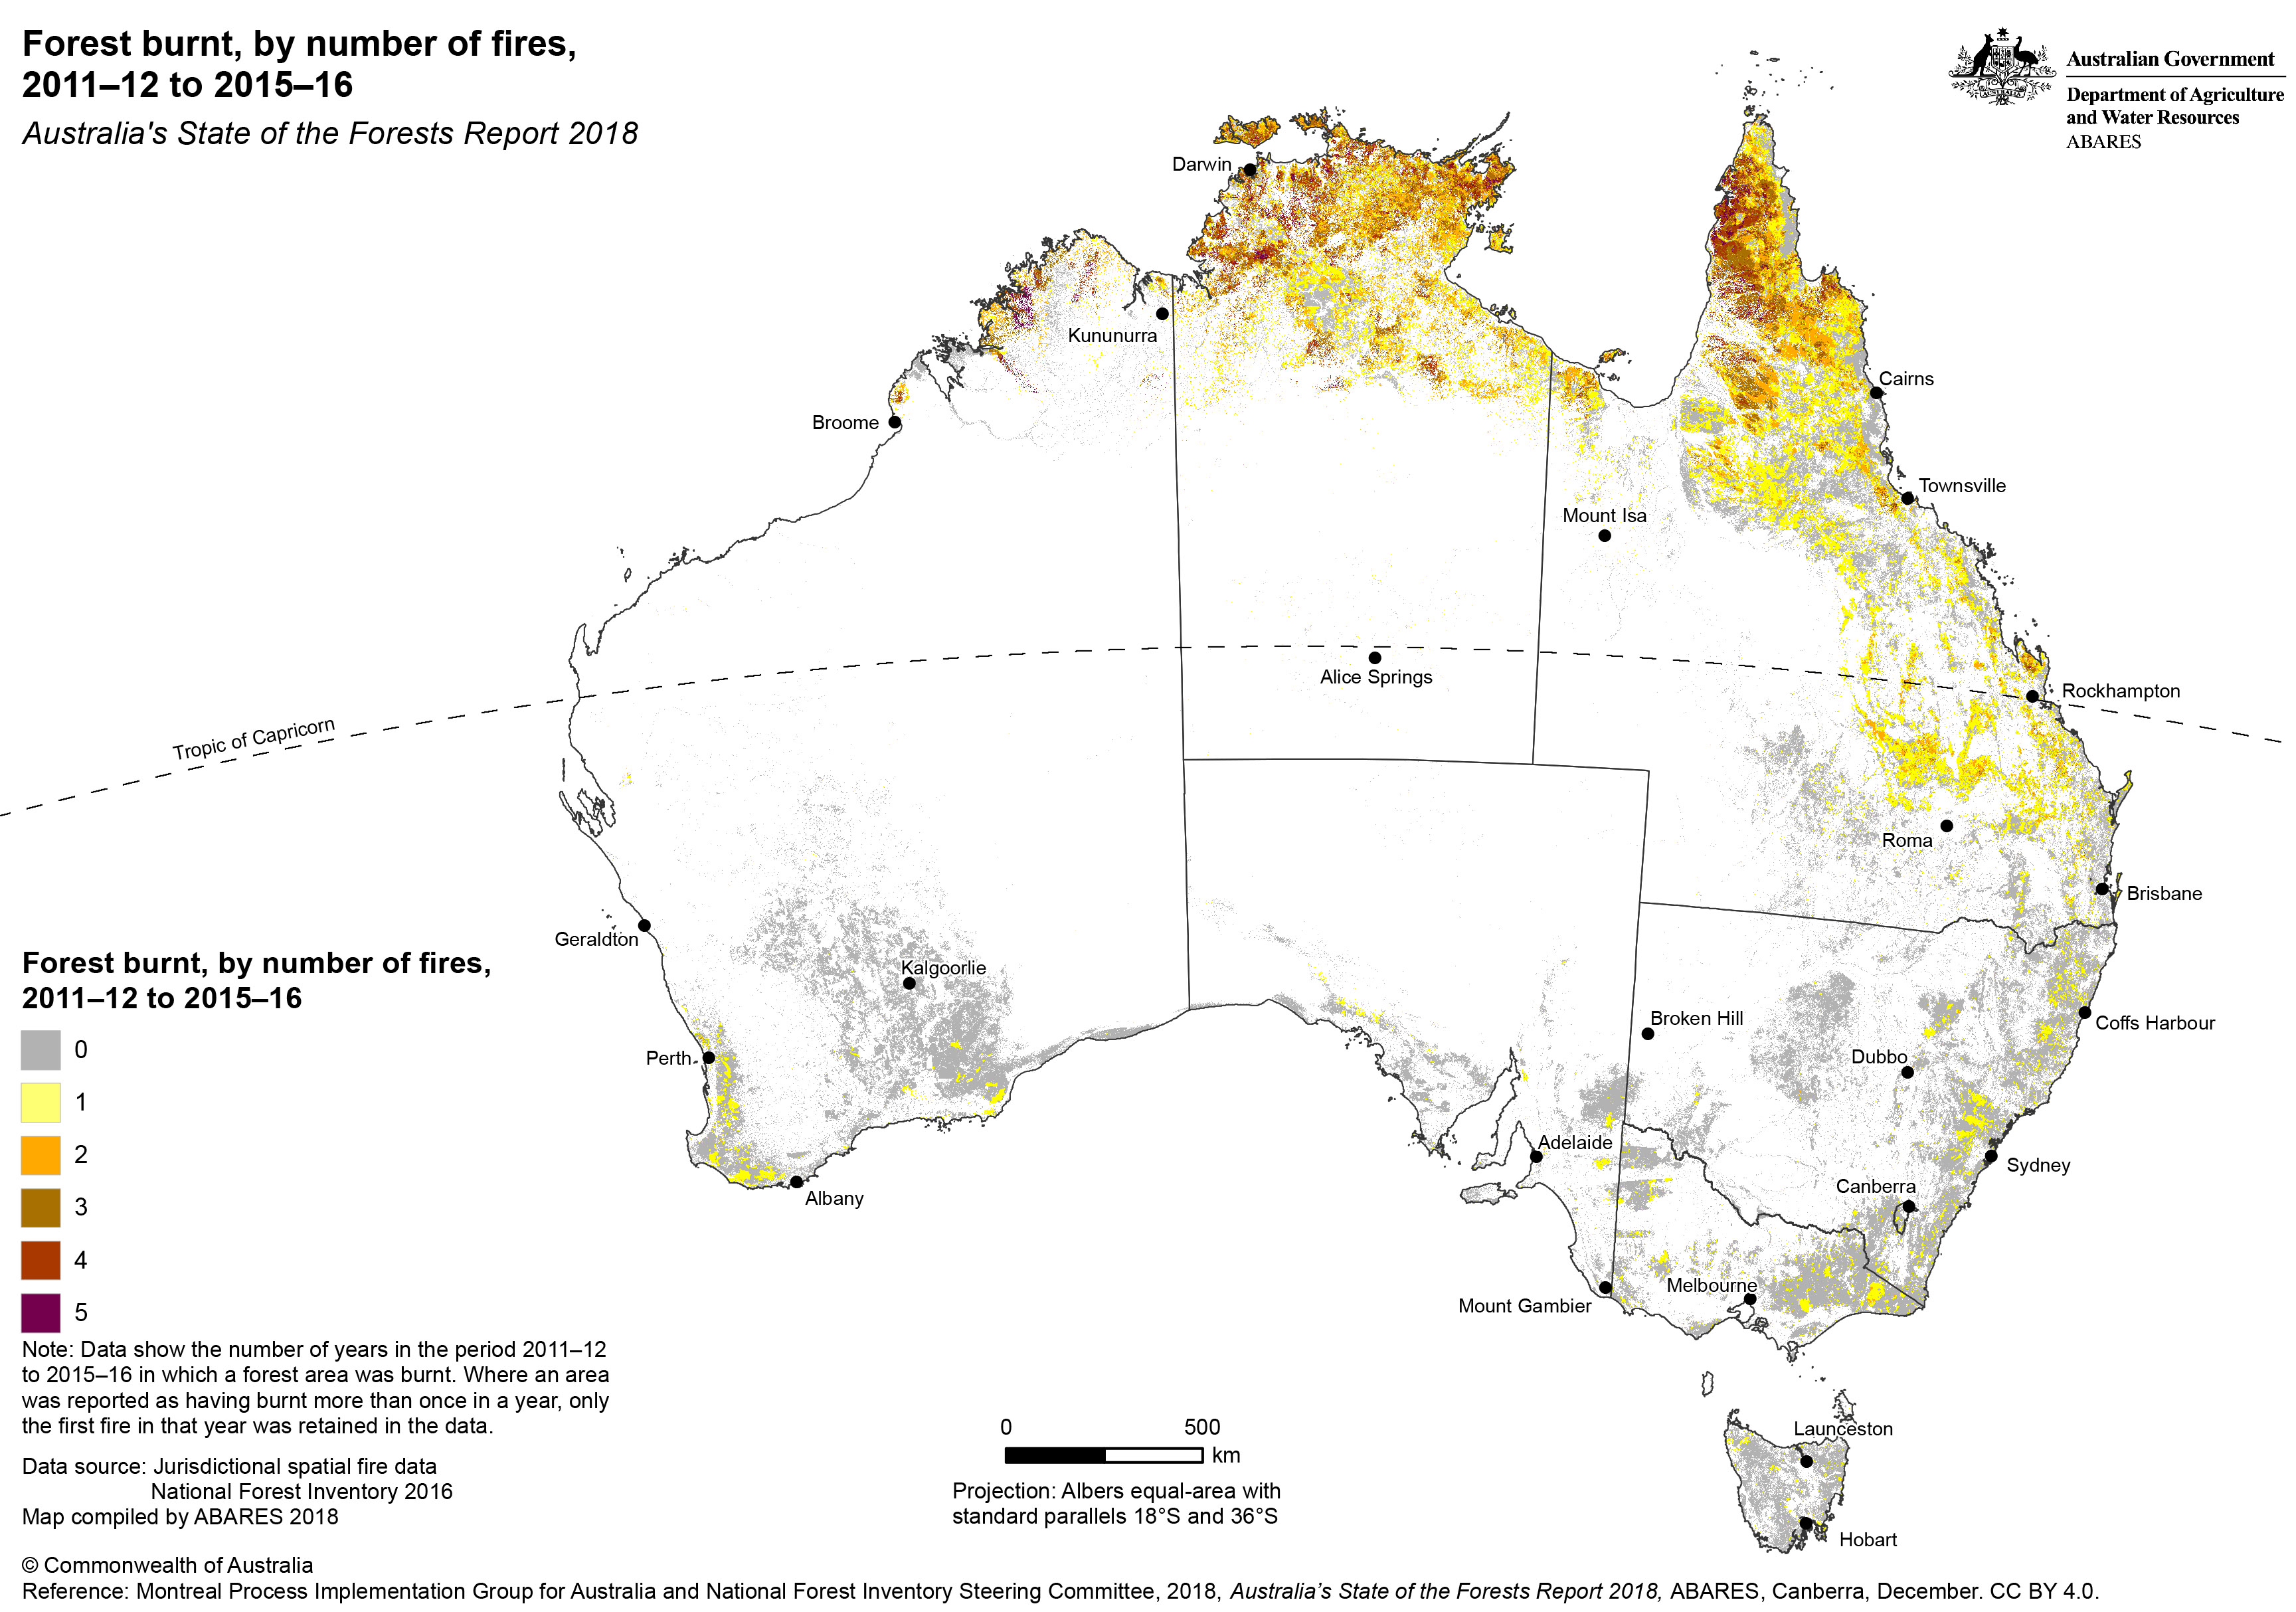
A downloadable higher resolution version of this map is available here.
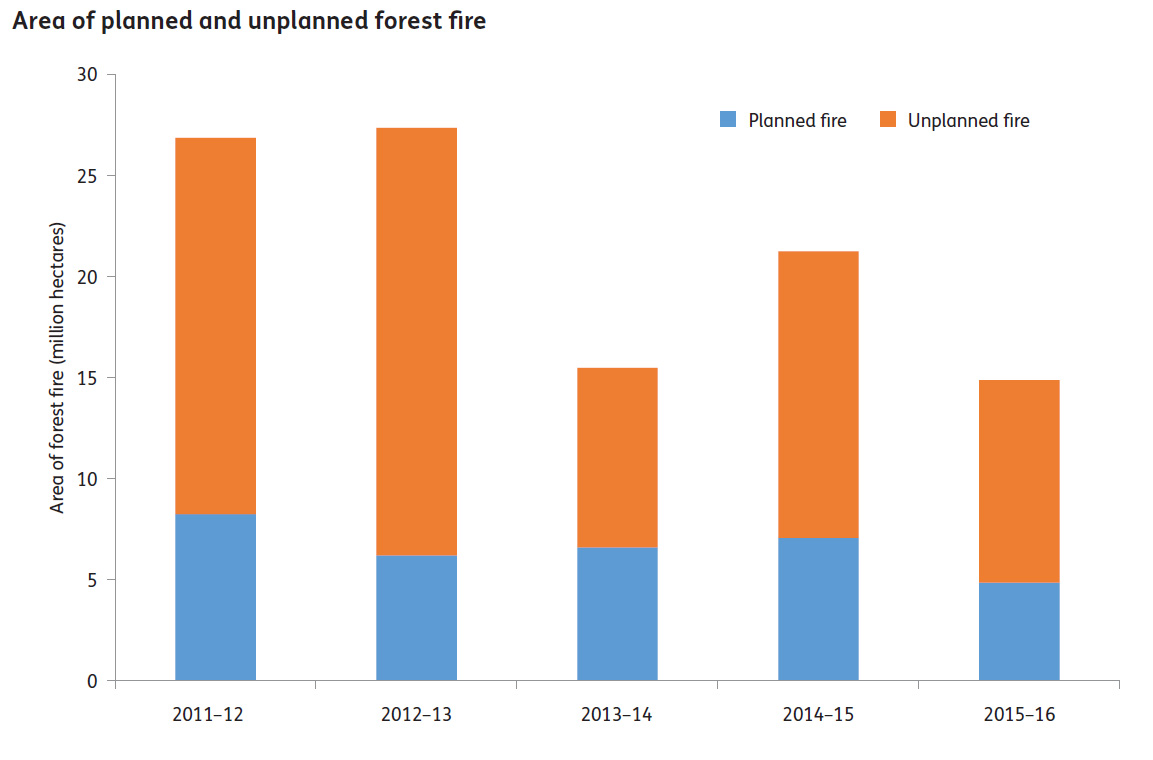
The annual area of fire in Australia’s forests in the period 2011–12 to 2015–16 varied from a high value of 27.4 million hectares in 2012–13, to a low value of 14.9 million hectares in 2015–16.
The cumulative area of fire in forest across this period (the sum of the forest fire areas for each of the five years) was 106 million hectares.
When areas of forest burnt in multiple years are allowed for, the total area of forest burnt one or more times during the period 2011–12 to 2015–16 was 55 million hectares (41% of Australia’s total forest area). The balance (59% of Australia’s forest area) did not experience fire in this period.
This figure and the data used to create it are available in Microsoft Excel [287 KB].
Of the cumulative area of fire in forests over this period, 69% was unplanned fire.
Planned fire is used as a forest management tool in fire-adapted forest types for forest regeneration, to promote regeneration after harvest, to maintain forest health and ecological processes, and to reduce fuel loads and thereby increase the ability to manage bushfires and protect vulnerable communities.
Carbon stocks in Australia’s forests increased by 0.6%, to 21,949 million tonnes, during the period 2011–16.
Of this forest carbon store, 85% was stored in non-production native forests, 14% in production native forests and 1.2% in plantations.
Over the period 2001–16, carbon stocks in forests have varied by no more than 0.7% of the total stock. Over the most recent five years (2011–16), forest carbon stocks increased by 129 Mt, due to a combination of recovery from past clearing, additional growth of plantations, reduced clearing of native forest, expansion of the area of native forests, and continued recovery from bushfire and drought.
Forests contributed to the net sequestration by the land sector of an amount of carbon dioxide that offset 3.5% of total human-induced greenhouse gas emissions in Australia over this period.
This was primarily due to sequestration through forest growth and forest management practices exceeding emissions from activities such as land clearing.
In addition, 94 million tonnes of carbon was present in wood and wood products in use in 2016, and 50 million tonnes of carbon in wood and wood products in landfill.
| Forest category | Carbon (million tonnes) | |||
|---|---|---|---|---|
| 2001 | 2006 | 2011 | 2016 | |
| Native forests | 21,765 | 21,583 | 21,557 | 21,676 |
| Plantations | 190 | 222 | 252 | 258 |
| Other forests | 6 | 8 | 11 | 15 |
| Total forest | 21,961 | 21,813 | 21,820 | 21,949 |
| Wood products in use | 77 | 83 | 89 | 94 |
| Wood products in landfill | 42 | 46 | 49 | 50 |
| Total wood products | 119 | 129 | 138 | 144 |
| Total forests and wood products | 22,080 | 21,943 | 21,958 | 22,093 |
Source of data: Australian Government Department of the Environment and Energy.
The data used to create this table are available in Microsoft Excel [287 KB].
A total of 27% of Australia’s forests are managed primarily for protective functions, including protection of soil and water values.
This area includes formal nature conservation reserves, informal reserves in multiple-use public forests, forests protected by prescription (such as steep slopes, erodible soil types and riparian – streamside – zones where harvesting and road construction are not permitted), and forested catchments managed specifically for water supply.
The range of native and established introduced pathogens and insect pests active during the period 2011–16 is comparable with previous reporting periods.
A total of 25 introduced vertebrate pest species, and 110 weed species, were reported as having an adverse effect on forests in one or more jurisdictions.
Myrtle rust is present in all states and territories except the Australian Capital Territory, South Australia and Western Australia.
Subtropical wet sclerophyll forest or rainforest communities that have mid-storey and understorey layers rich in species of the Myrtaceae family are being severely altered by myrtle rust, with populations of two widespread species, Rhodamnia rubescens and Rhodomyrtus psidioides, in rapid local decline.
Forests continue to be impacted by climatic conditions.
Forests affected by the extended drought that persisted in southern Australia until 2010 commenced recovery in the period 2011–16, and the activity of secondary pests and pathogens that attacked drought-stressed trees has declined.
Extensive areas of mangrove along the southern coast of the Gulf of Carpentaria suffered rapid dieback and mortality in late 2015. The event coincided with unusually low sea-levels and several climate anomalies, which in combination are thought to have produced hypersaline conditions that were beyond levels tolerated by the mangrove species.
For further information on forest condition and function in Australia, see Indicator 1.1b, Indicator 1.1d, Indicators 3.1a–b, Indicators 4.1a–e, Indicator 5.1a and Indicator 6.1c of Australia’s State of the Forests Report 2018.
Australia’s plantations and native forests provide for commercial production of wood products, under a range of silvicultural systems. Following harvest, areas are regenerated or replanted.
This figure and the data used to create it are available in Microsoft Excel [287 KB].
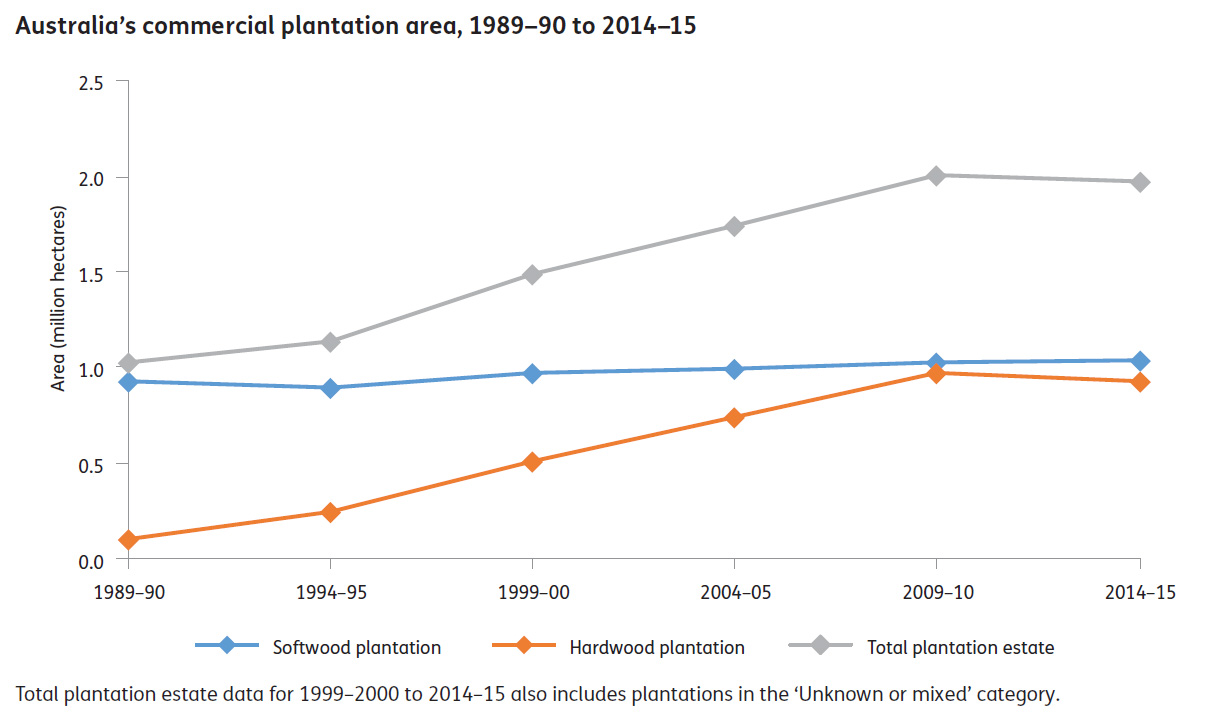
The area of commercial plantation was 1.95 million hectares in 2014–15. This area increased from 1990 to 2010, but reduced by 44 thousand hectares (2%) between 2010–11 and 2014–15.
In 2014-15, the area of commercial plantations comprised 1.0 million hectares of softwood species (mostly pines), 0.9 million hectares of hardwood species (mostly eucalypts), and 0.01 million hectares of unknown or mixed species plantations.
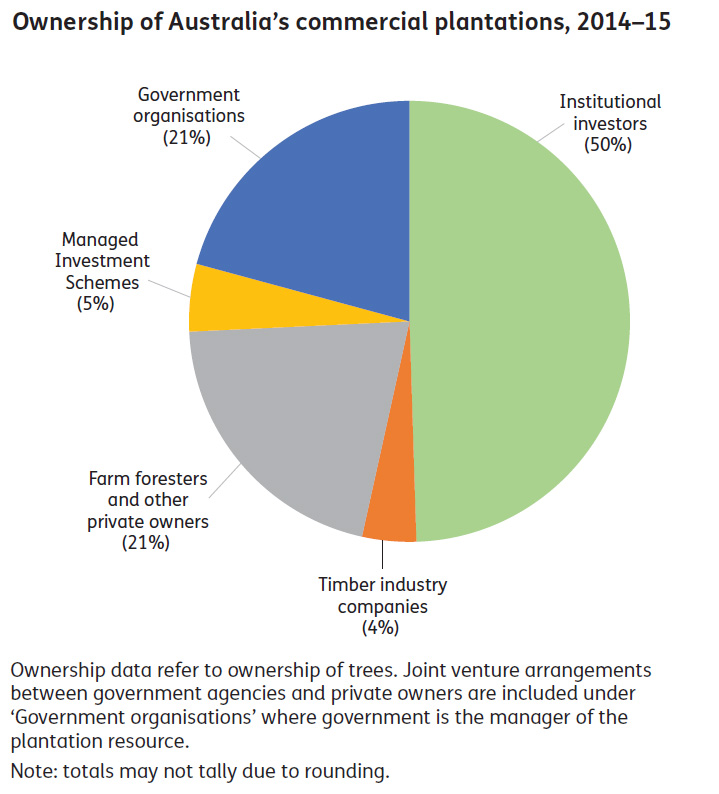
The area proportion of commercial plantations where the trees are privately owned increased from 76% in 2010-11 to 79% in 2014–15, while the area proportion where the trees are owned by government organisations decreased from 24% in 2010-11 to 21% in 2014-15.
This figure and the data used to create it are available in Microsoft Excel [287 KB].
The extent of native forest that is available and suitable for commercial wood production on private and public land decreased from 29.3 million hectares in 2010–11 to 28.1 million hectares in 2015–16.
This area of 28.1 million hectares includes 21.8 million hectares on leasehold and private tenure, and 6.3 million hectares of multiple-use public native forests.
This figure and the data used to create it are available in Microsoft Excel [287 KB].
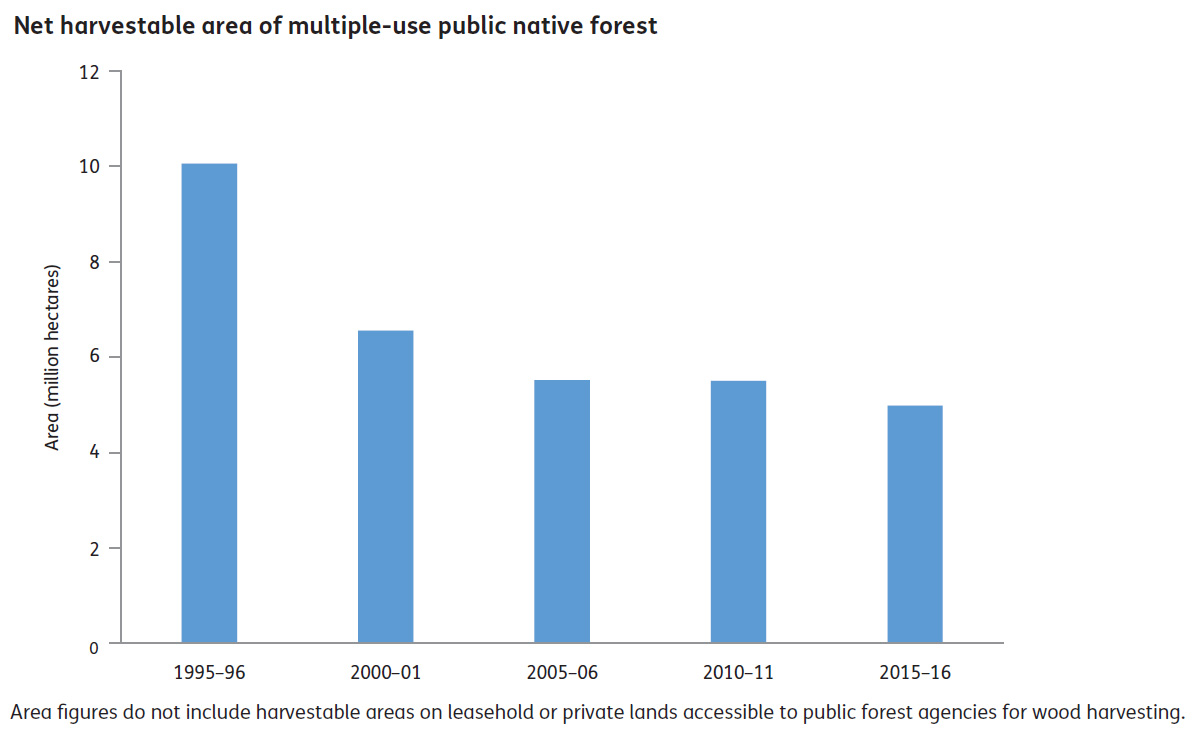
The net harvestable area of multiple-use public native forests decreased from 5.5 million hectares in 2010–11 to 5.0 million hectares in 2015–16.
The net harvestable area is the area available for harvesting when additional exclusions and restrictions to manage non-wood values are taken into account.
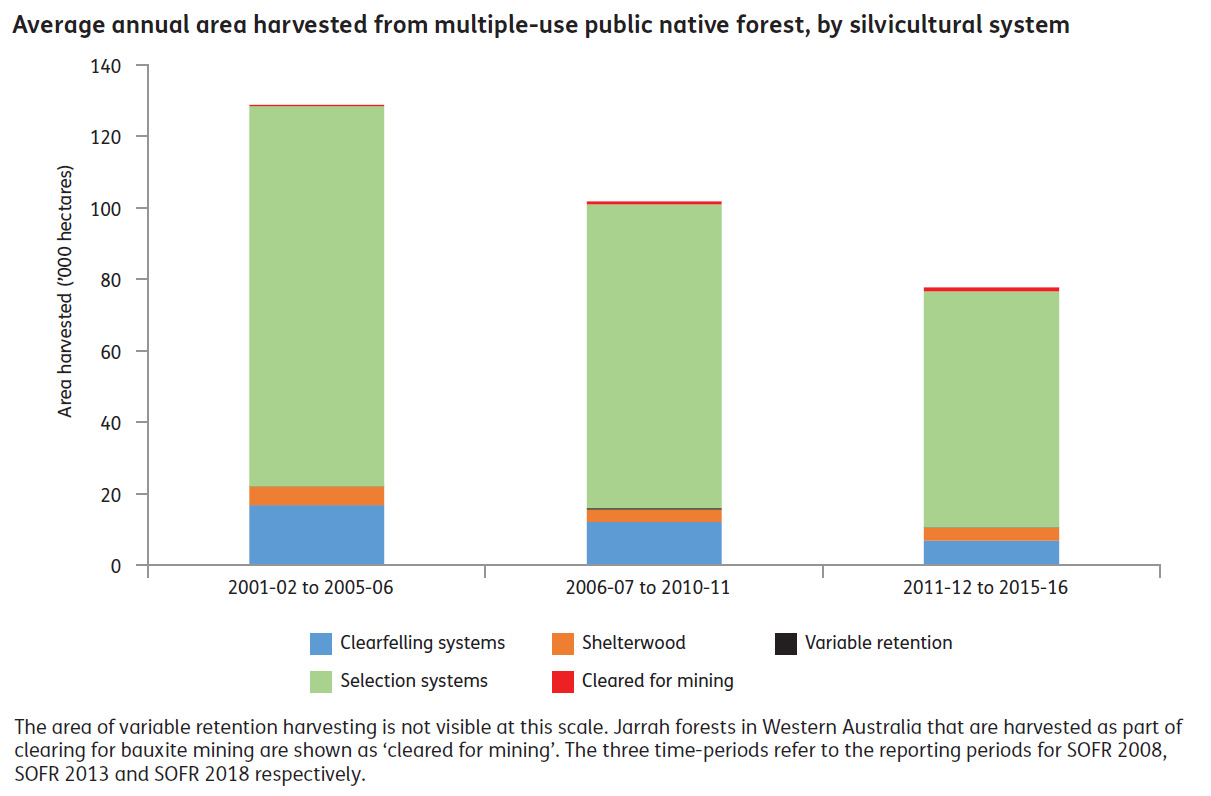
The average annual area of multiple-use public native forest from which wood was harvested decreased to 78 thousand hectares over the period 2011–12 to 2015–16.
This is a 24% decrease from the annual average of 102 thousand hectares for the period 2006–07 to 2010–11, which in turn was a 21% decrease from the annual average of 129 thousand hectares for the period 2001–02 to 2005–06.
The total area harvested on multiple-use public native forests in 2015–16, 73 thousand hectares, is 1.5% of the net harvestable area of public native forest, and 0.75% of the total area of multiple-use public native forest.
This figure and the data used to create it are available in Microsoft Excel [287 KB].
Within the area of multiple-use public native forests harvested from 2011-12 to 2015-15, the proportion harvested by clearfelling systems decreased to 9%, while 86% was harvested using selection systems, 5% by shelterwood systems, and 0.2% by variable retention systems.
The annual average area harvested by clearfelling systems decreased from 17 thousand hectares in 2001–02 to 2005–06, to 12 thousand hectares in 2006–07 to 2011–12, to 7 thousand hectares in 2011–12 to 2015–16.
For further information on Australia's production forests, see the Introduction, Indicator 1.1a and Indicators 2.1a–c of Australia’s State of the Forests Report 2018.
Wood and non-wood products from Australia’s forests make a substantial contribution to the economy and to society more generally. An increasing proportion of Australia’s wood is produced in plantations.
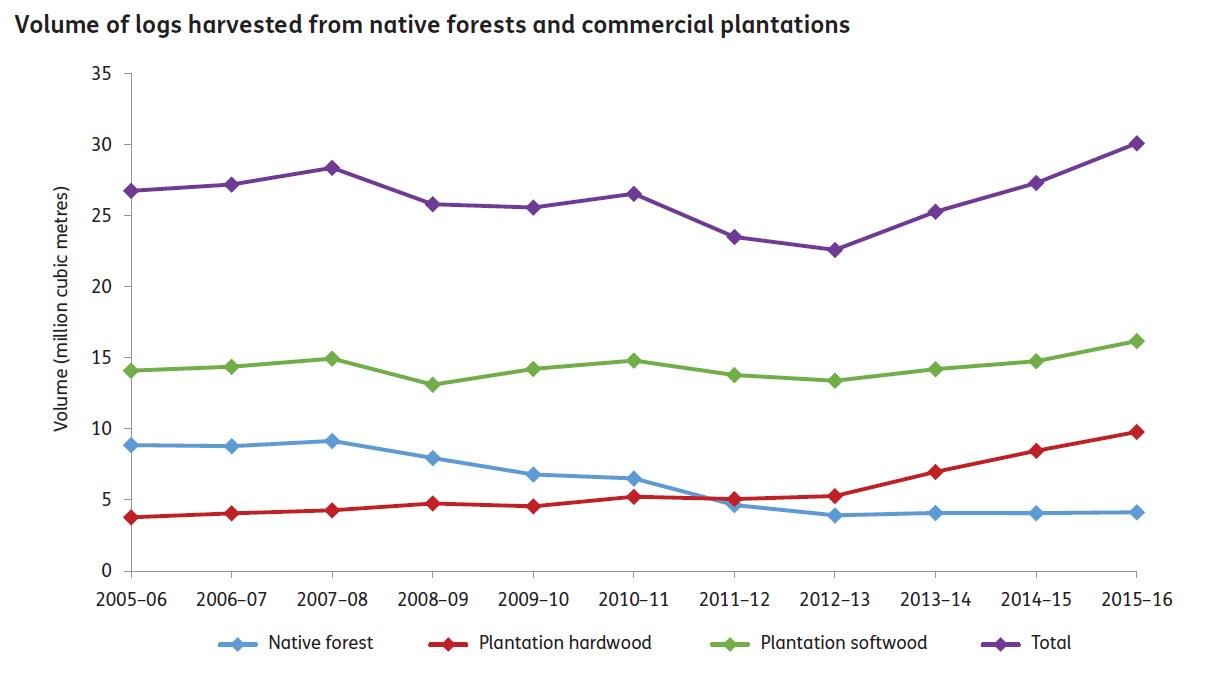
Australia’s log harvest in 2015–16 was 30.1 million cubic metres, a 13% increase from 2010–11. This is an increase from 26.5 million cubic metres in 2010–11.
This figure and the data used to create it are available in Microsoft Excel [287 KB].
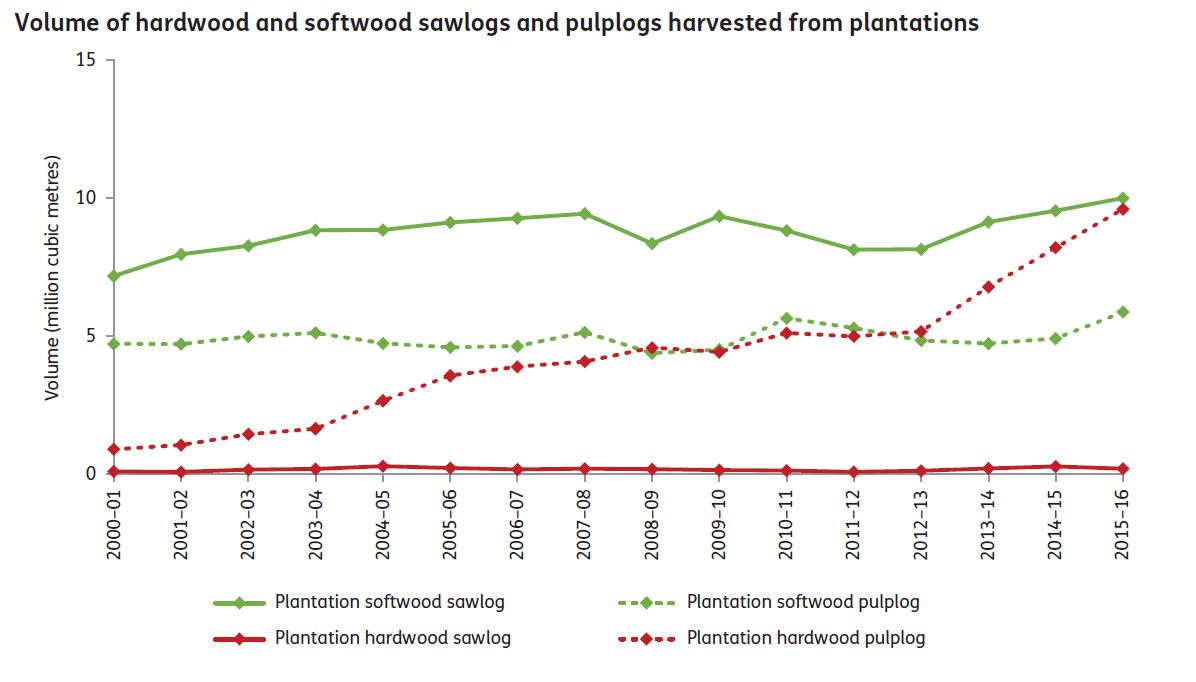
Over the period 2010–11 to 2015–16, the volume of logs harvested from commercial plantations increased by 30%, from 20.0 million cubic metres to 26.0 million cubic metres.
The volume of logs harvested in 2015–16 comprised 9.8 million cubic metres of plantation hardwood logs (mostly pulplogs) and 16.2 million cubic metres of plantation softwood logs (both sawlogs and pulplogs).
In 2015–16, 86% of the volume of logs harvested in Australia was from commercial plantations.
This figure and the data used to create it are available in Microsoft Excel [287 KB].
Over the period 2010–11 to 2015–16, the volume of logs harvested from native forests declined by 37%, from 6.5 million cubic metres to 4.1 million cubic metres.
A progressive reduction in native forest harvest volumes has occurred over the last 20 years in all jurisdictions in which there is harvesting of native forest, due to reduction in areas available for wood production, and changes in national and international markets. The national harvest of sawlogs from private native forests has also declined progressively since the period 2001-06. The reasons for this decline differ between states, and are not always clear.
In 2015–16, the value of logs harvested from native forests and commercial plantations was $2.3 billion.
This was an increase of 22%, from $1.9 billion in 2010–11.
In 2015–16, the value of production of wood products industries (total industry turnover, or sales and service income) was $23.7 billion.
This was a decrease of 2%, from $24.0 billion in 2010–11.
In 2015–16, the value added by the forest and wood products industries was $8.6 billion, representing a contribution to Australia’s gross domestic product of 0.52%.
In 2010–11 the value added was $8.3 billion, a contribution of 0.59%.
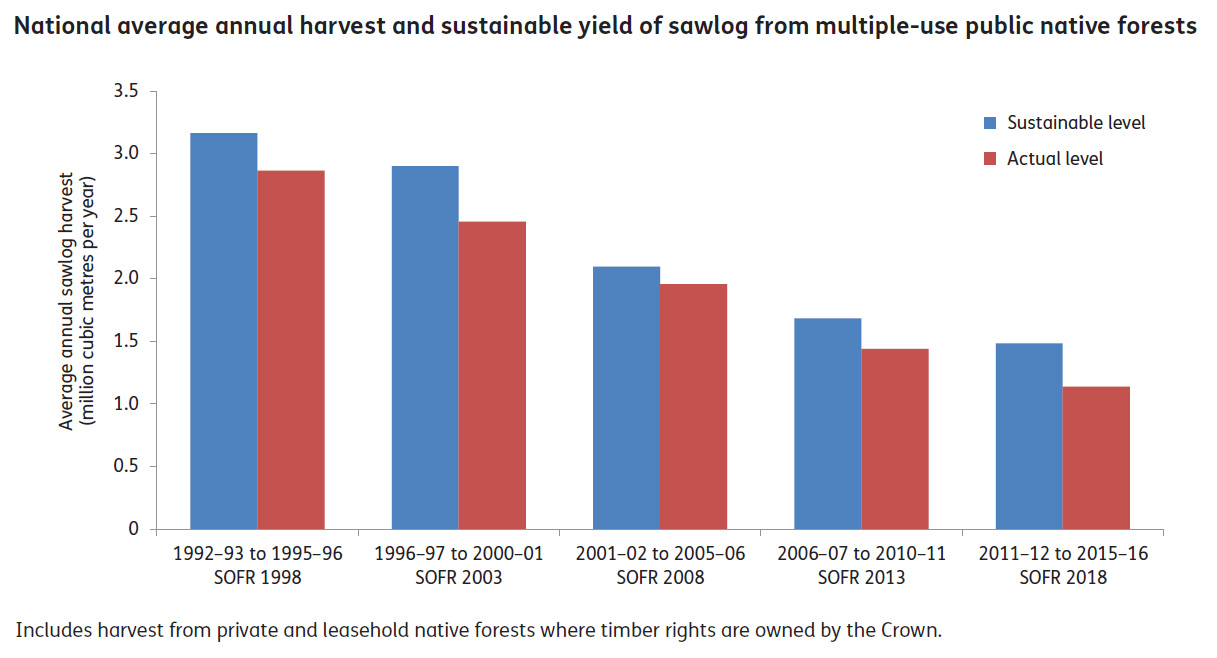
The volume of sawlogs harvested from public native forests in the period 2011–12 to 2015–16 was within sustainable yield levels in New South Wales, Tasmania, Victoria and Western Australia, and was within the allowable cut in Queensland.
The sustainable annual yield of high-quality sawlogs from multiple-use public native forests has declined by 53% from 1992–93 to 2015–16.
Reasons for this decline include the transfer of multiple-use public native forests into nature conservation reserves, increased restrictions on harvesting, revised estimates of growth and yield, and (especially in Victoria) impacts of occasional, intense broad-scale bushfires.
This figure and the data used to create it are available in Microsoft Excel [287 KB].
Australia produces a wide range of non-wood forest products derived from forest fauna, flora and fungi, and many non-wood forest products supply commercial domestic and export markets. High-value non-wood forest products include wildflowers, seed, honey, and aromatic products derived from tea-tree and sandalwood.
Information on the production, consumption and trade of non-wood forest products is also often difficult to obtain because of the generally small size of industries based on these products and their dispersed nature.
Australia’s trade in wood products experienced strong growth over the past decade, with the sum of imports and exports (total merchandise trade) exceeding $8 billion for the first time in 2015–16.
Australia continues to be a net importer of wood and wood products.
In 2015–16, the total value of wood product imports was $5.5 billion, while the total value of wood product exports was $3.1 billion.
Over the period 2010–11 to 2015–16, consumption of sawnwood increased by 12%, consumption of wood-based panels increased by 5%, and consumption of paper and paperboard fell by 8%. Residential use of firewood declined by 12% in the same period, whereas industrial use of fuelwood increased by 19%.
In 2015–16, 1.7 million tonnes of recycled paper were used for domestic paper and paperboard production in Australia, contributing 53% of paper and paperboard produced.
For further information on Australia's harvested wood and non-wood forest products, see Indicators 2.1c–e, Indicators 6.1a–b and Indicators 6.1d–e of Australia’s State of the Forests Report 2018.
The forest sector is a significant employer in rural and regional Australia. Educated workers are integral to the development of the forest and wood products industries, and economic diversity, community wellbeing and capital resources contribute to resilient communities.
Total national direct employment in the forest sector was 51,983 persons in 2016, a 24% decrease from 2011.
The key drivers for this decrease were consolidation of processing into larger facilities with higher labour efficiencies, and restructuring of the sector.
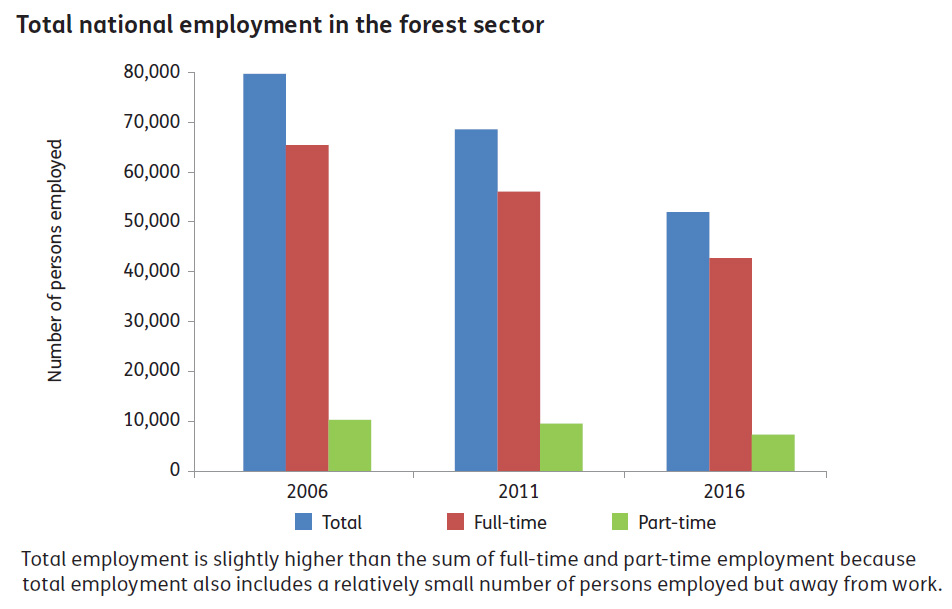
This figure and the data used to create it are available in Microsoft Excel [287 KB].
A total of 30 Local Government Areas are rated as dependent on forest and wood products industries through having 2% or more of their working population employed in the sector and containing more than 20 workers employed in these industries.
Five of these LGAs had 8% or more of their workforce employed in the forest and wood products industries.
Large proportional increases in forest and wood products industries employment were in LGAs in south-west Victoria and northern Tasmania.
Nationally, 28% of forest sector workers households had weekly incomes below $800. This is slightly lower than the proportion for total workforce households.
Between 2010–11 and 2014–15, the number of serious injury claims rose by 5% in the forestry and logging subsector (from 137 to 144), and fell by 25% in the wood and paper product manufacturing subsector (from 1,826 to 1,371).
Levels of community adaptive capacity varied considerably across the 30 Local Government Areas rated as dependent on forest and wood products industries.
In 2016, the median age of forest and wood products workers was from 40 to 50 years in 22 of the 30 LGAs dependent on forest and wood products industries.
Nationally, 54% of forestry workers had non-school qualifications in 2016, compared with 65% in the total workforce.
In 25 of the 30 LGAs dependent on forest and wood products industries, the proportion of forestry workers with qualifications increased between 2011 and 2016. In the tertiary sector, there has been a decreasing trend in undergraduate degree completions, and an increasing trend in postgraduate degree completions.
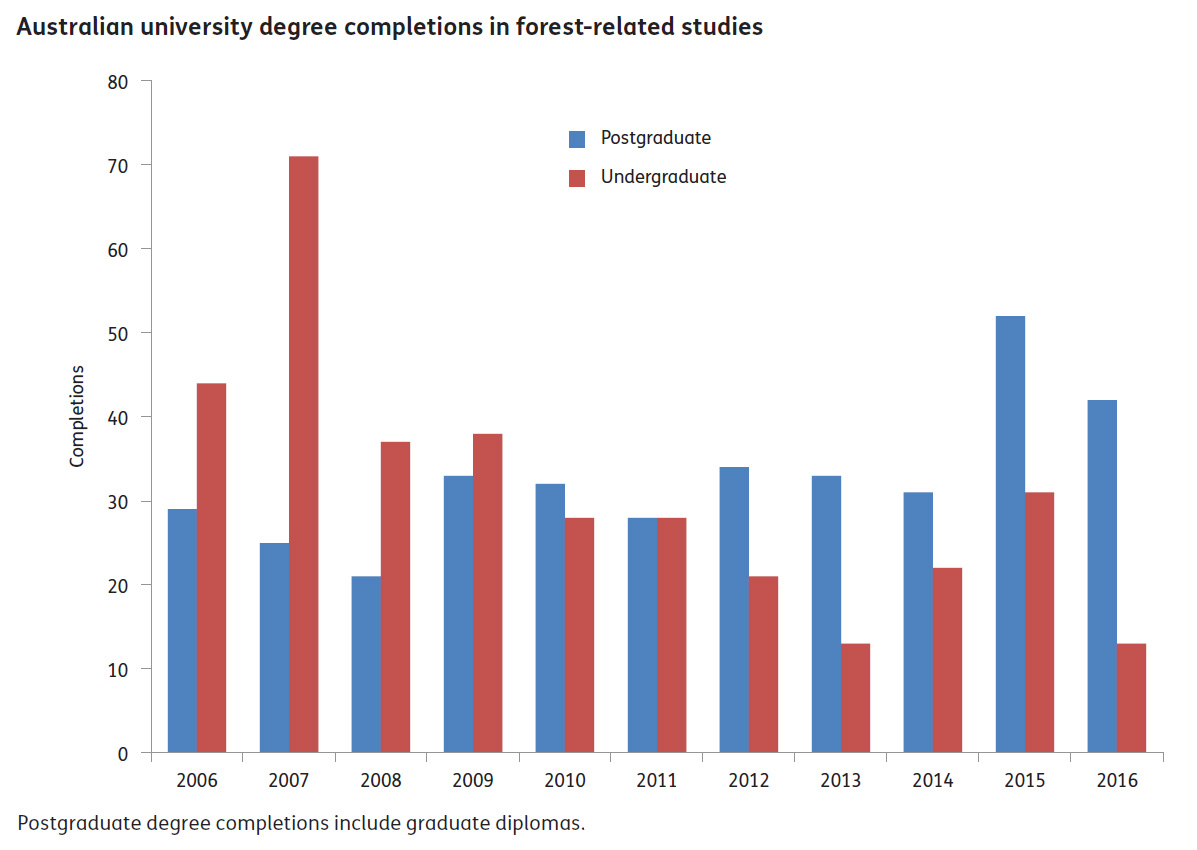
This figure and the data used to create it are available in Microsoft Excel [287 KB].
For further information on Australia's forest related employment and education, see Indicators 6.5a–c and Indicators 7.1b–c of Australia’s State of the Forests Report 2018.
Australia’s forests provide multiple social values to the community. They provide opportunities for tourism and recreation, and include many sites that provide evidence of the interactions between people and forest landscapes.
In 2016, 11.0 million hectares of forest was on non-Indigenous heritage-listed sites. In addition, in 2016 there were an estimated 126 thousand registered Indigenous heritage sites within forest.
The 11.0 million hectares of forest on non-Indigenous heritage-listed sites was an increase of 3.7 million hectares since 2011, mainly due to the registration of new heritage places. Indigenous heritage sites are widespread across Australia’s forests.
Most forests in nature conservation reserves and multiple-use public native forests in Australia are available to the general public for recreation or tourism purposes. An annual average of 4.2 million visitors visited major forested tourism regions for bushwalking in the period 2011–12 to 2015–16.
Kakadu National Park in the Northern Territory is an example of reserved forest on private land tenure that is available for recreation and tourism.
The degree of management control and influence that Indigenous people have over forest relates to the Indigenous ownership and management category into which the forest is classified: Indigenous owned and managed, Indigenous managed, Indigenous co managed, or covered by Other special rights.
Together, land in these four categories comprises the Indigenous forest estate, which covers a total of 70 million hectares of forest (52% of Australia’s forests).
The largest areas of forest in the Indigenous estate occur within Indigenous Land Use Agreement areas, and areas for which there has been a native title determination.

A downloadable higher resolution version of this map is available here.
In 2016, the forest and wood products industries directly employed 1,099 Indigenous people, while an estimated 337 Indigenous people were employed in conservation or park operation roles in areas with forested conservation reserves.
In seven Indigenous Locations across Australia, more than 10% of the Indigenous workforce was employed in the forest and wood products industries.
There is a range of public perceptions of forest management and of the acceptability of plantations.
Surveys conducted between 2008 and 2017 on behalf of Forest and Wood Products Australia indicate the attitudes of Australians to a range of forest-related issues. Topics surveyed included whether Australia’s native forests are being managed sustainably, which materials are environmentally friendly, whether Australian trees or overseas trees are preferred for making wood products, and whether harvesting trees to make wood products is acceptable.
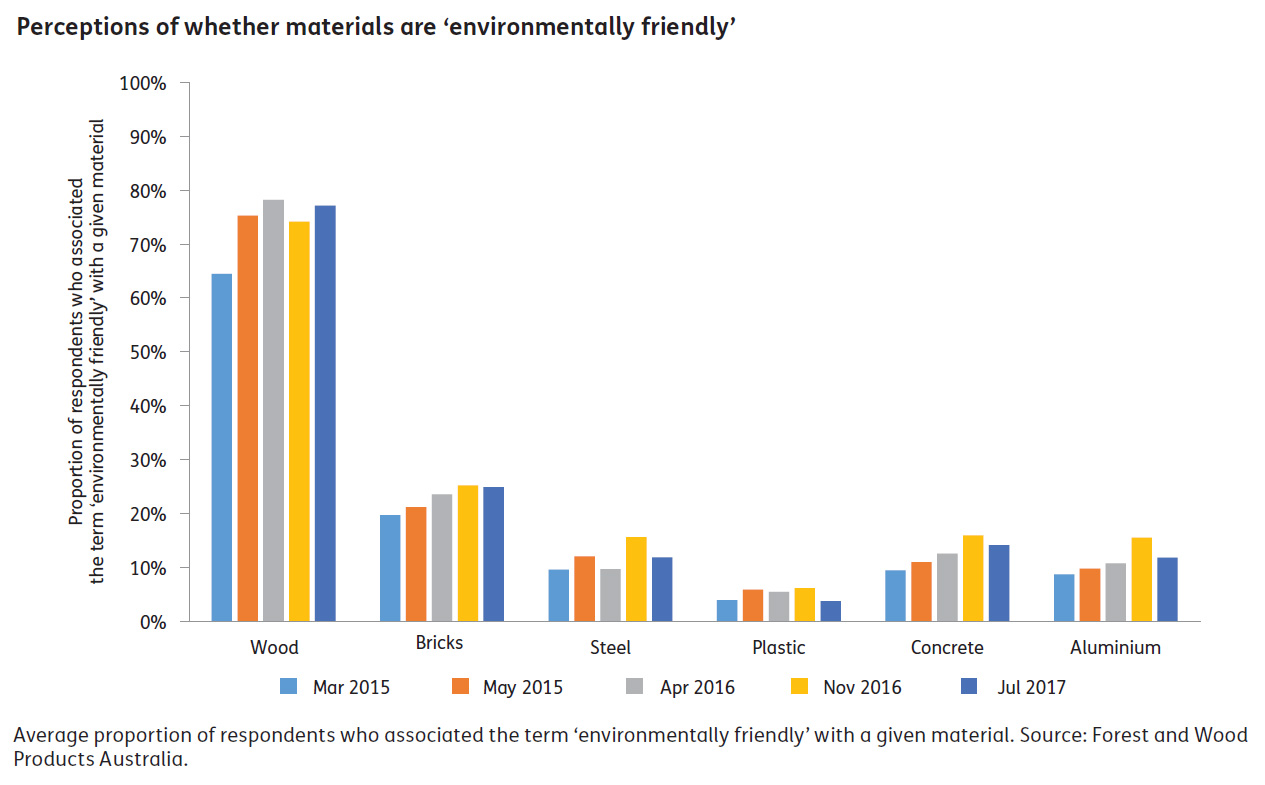
This figure and the data used to create it are available in Microsoft Excel [287 KB].
For further information on social and community aspects of Australia's forests, see Indicators 6.3a–b, Indicators 6.4a–d and Indicator 6.5d of Australia’s State of the Forests Report 2018.
Investment in establishing and managing native forests and plantations is key to maintaining forest values and services. Research and development underpin improved management practices and new commercial technologies and facilities.
Between 2010–11 and 2014–15, funding for new commercial plantations was increasingly sourced from institutional investors.
In 2014−15, institutional investors owned 50% of Australia’s commercial plantations, compared to 31% in 2010−11. During the same period, farm foresters and other private owners increased their area share of total commercial plantation area from 8% to 21%.
Capital investment in timber industry processing facilities was estimated at $938 million for the period 2012 to 2017.
The majority of these new investments targeted increased productivity, higher recovery and improved grade yield in the sawmilling sectors, and increased productivity and development of new products in the panel and plywood sectors.
Two different surveys show that expenditure on research and development in forestry and forest products has declined over time, as has associated capacity. The number of people involved in research and development in forestry and forest products has also continue to decline.
Australian Bureau of Statistics data show that, from 2007–08 to 2013–14, total expenditure on research and development reported by businesses in the forest and wood products sector declined from $144 million to $86 million, although only partial data are available for some years.
In parallel, the estimated number of researchers and technicians involved in research and development in forestry and forest products declined from 733 in 2008, to 455 in 2011, and to 276 in 2013.
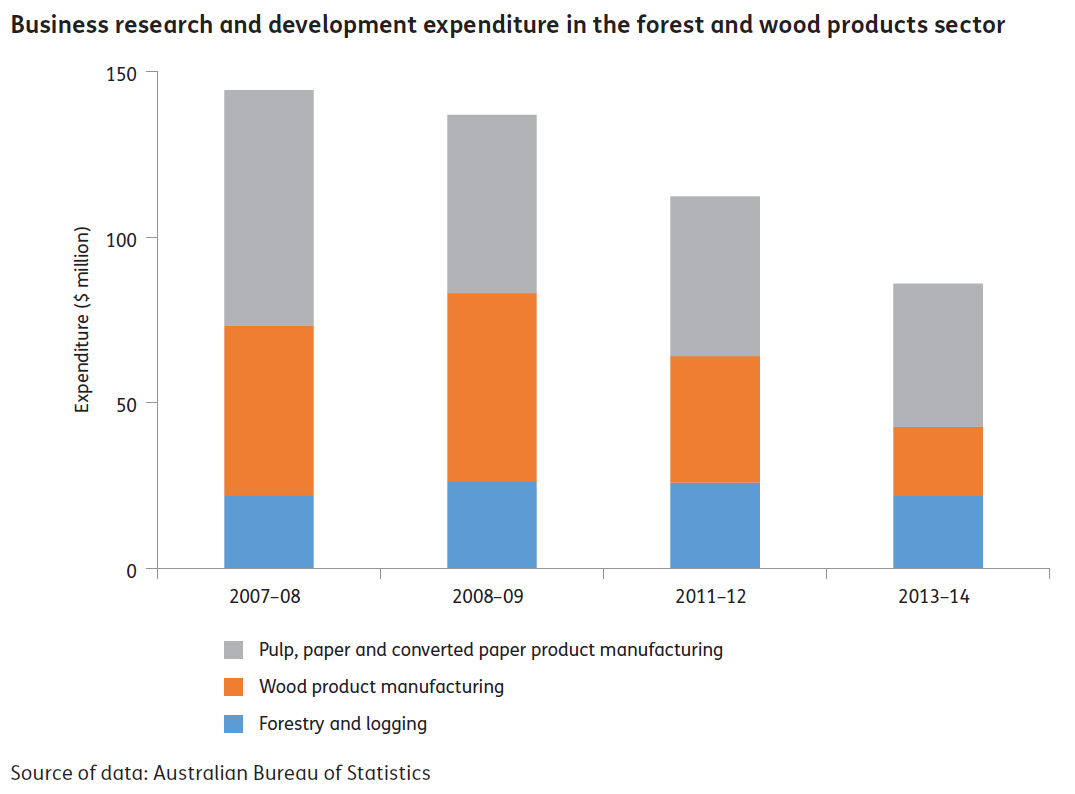
This figure and the data used to create it are available in Microsoft Excel [287 KB].
For further information on forest investment, research and development in Australia, see Indicators 6.2a–b, Indicator 7.1c and Indicator 7.1e of Australia’s State of the Forests Report 2018.
Australia’s forest policy and management is underpinned by legal, institutional and economic frameworks at the national and the state and territory levels. These frameworks provide for reporting to the community on the state of Australia’s forests.
Australia has a well-established framework for forest management, guided by a National Forest Policy Statement, and including policy and legislative instruments, and codes of forest practice.
All states and territories and the Australian Government have legislation that supports the conservation and sustainable management of Australia’s forests on public and private lands.
As at 2016, 43 million hectares (32% of Australia’s forests) were covered by management plans relating to their conservation and sustainable management. Within this area, management plans are in place for 19 million hectares of forest in the National Reserve System (57% of the area of forest in the National Reserve System).
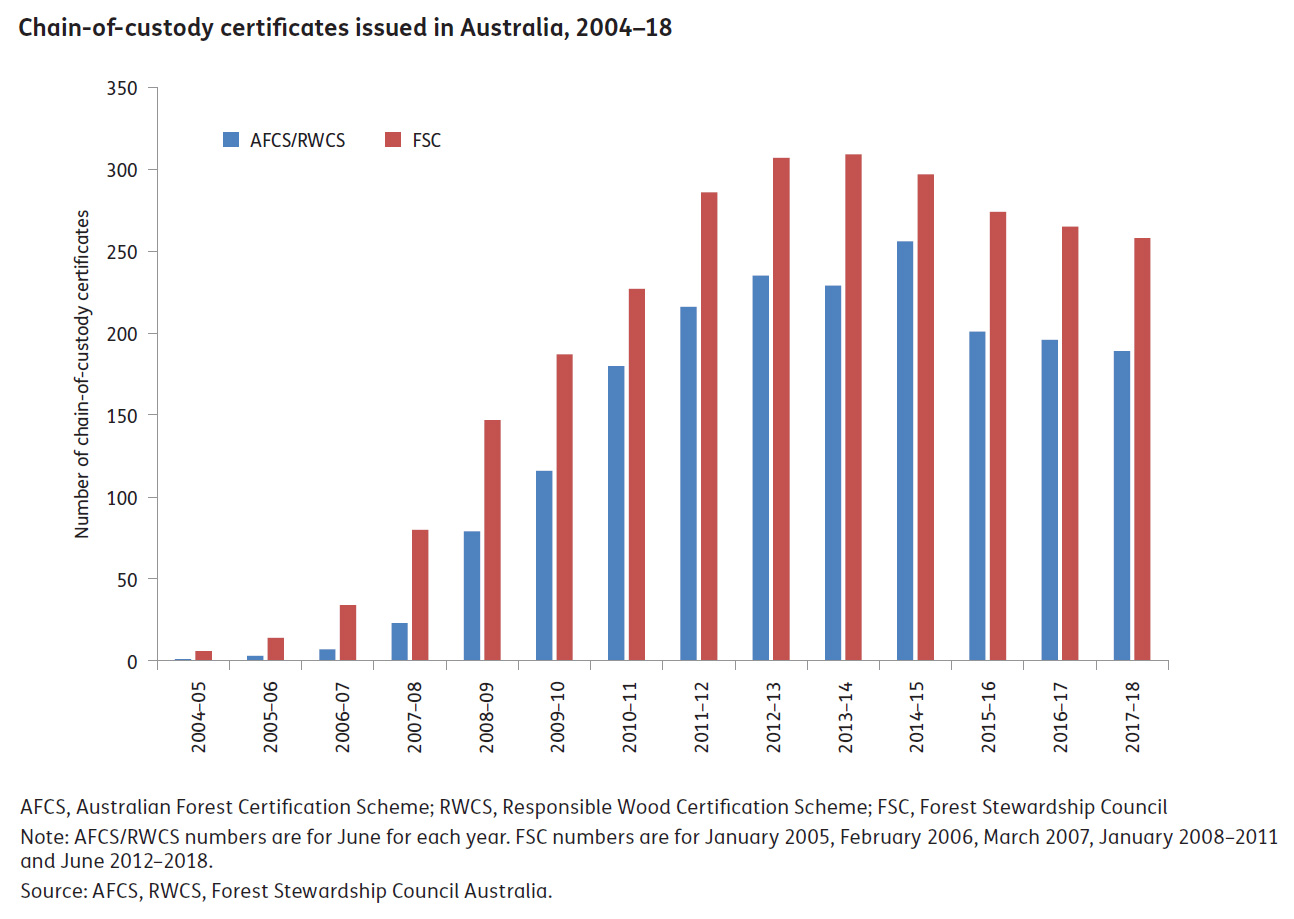
This figure and the data used to create it are available as Figure 7.4 in Microsoft Excel [63 KB].
The Responsible Wood Certification Scheme and the Forest Stewardship Council scheme certify forest management and provide chain-of-custody certificates for tracking wood products.
At June 2018, approximately 8.9 million hectares of native forests and plantations were certified for forest management under either scheme, with some forests and plantations certified under both schemes.
At June 2018, a total of 189 chain-of-custody certificates for tracking wood from the forest to the final product were issued under the Responsible Wood Certification Scheme, and 258 chain-of-custody certificates were issued under the Forest Stewardship Council scheme.
Reporting to the community on Australia’s forests occurs at the state level, nationally and internationally.
Australia’s National Forest Policy Statement (Commonwealth of Australia 1992) commits the Australian Government and state and territory governments to report on the state of the forests every five years. In addition, the Commonwealth Regional Forest Agreements Act 2002 states that ‘the Minister must cause to be established a comprehensive and publicly available source of information for national and regional monitoring and reporting in relation to all of Australia’s forests’.
The Australia’s State of the Forests Report (SOFR) series implements these commitments. Australia also uses the data compiled for the SOFR series to report internationally on the state of its forests through:
- the Global Forest Resources Assessment and the State of the World’s Forest Genetic Resources processes undertaken by the Food and Agriculture Organization of the United Nations
- the United Nations Sustainable Development Goals
- the Global Forest Goals of the United Nations Forum on Forests Strategic Plan for Forests 2017–2030.
The data available for SOFR 2018 were assessed as comprehensive in each of coverage, currency and frequency for 23 of the 44 national reporting indicators, and as comprehensive in two of these three aspects for a further 11 indicators.
The most comprehensive information is available for multiple-use public forests, with less information on nature conservation reserves, and significant gaps in data collection and monitoring for leasehold and private forests and for other Crown land.
Overall, Australia’s State of the Forests Report 2018 addresses its purpose of being a ‘comprehensive national report’, and provides the reader with information to assess progress towards sustainable forest management in Australia.
For further information on Australia's frameworks for forest policy, management, monitoring and reporting, see the Introduction and Indicators 7.1a–d of Australia’s State of the Forests Report 2018.
