This indicator assesses the contribution of Australian forests to the global carbon cycle. Forest management can have a significant positive or negative impact on the global carbon cycle.
This is the Key information for Indicator 5.1a, published October 2024.
- The total stock of carbon in Australia’s forests was 19,417 million tonnes in 2021, and the total stock of carbon in harvested wood products was 167 million tonnes.
- The total forest carbon stock in 2021 was 9 million tonnes (0.05%) larger than in 2016, a net change that combines losses from decay, fire and other disturbances with gains from forest growth. The stock of carbon in harvested wood products in 2021 was 8 million tonnes (5%) larger than in 2016.
- Since 2001, carbon stocks have increased in plantations and public and private native forests managed for wood production, and decreased in non-production native forests. This reflects the generally younger age-classes and more rapid carbon assimilation in softwood plantations established in the decade from 2000 and post-harvest regeneration in public and private native forests managed for wood production.
- Harvested native forests provided a net sink of 35.7 million tonnes carbon dioxide-equivalent in 2021, corresponding to 8% of Australia’s total greenhouse gas emissions in 2021. Harvested wood products provided a net sink of 4.9 million tonnes carbon dioxide-equivalent in 2021.
The National Greenhouse Accounts are Australia’s system for calculating annual national greenhouse gas emissions resulting from human activities, and underpin reporting of emissions according to international rules by the Australian Government Department of Climate Change, Energy, the Environment and Water (DCCEEW) through the National Inventory Report series. Forest management is accounted for in the Land use, land use change and forestry (LULUCF) sector. Forest carbon stocks and flows are determined using spatial simulations of land use changes detected by satellite imagery, in conjunction with the Full Carbon Accounting Model (FullCAM) that uses a mass-balance approach to carbon cycling in forest carbon pools. Changes in carbon in the pools of harvested wood products in use and in landfill in Australia are determined with a stock-change approach.
Improved methods for modelling and calculation of carbon stocks and flows are applied retrospectively to the complete time-series of satellite data, similar to methods for determining forest area change over time (Indicator 1.1a.iv). As such, and as with forest area change data, comparisons of carbon data presented in this Indicator to carbon data in previous Australia’s State of the Forests Reports are likely not to be valid.
A more detailed coverage of forest carbon dynamics and the role of forests in the carbon cycle is presented in Indicator 5.1a of Australia’s State of the Forests Report 2018.
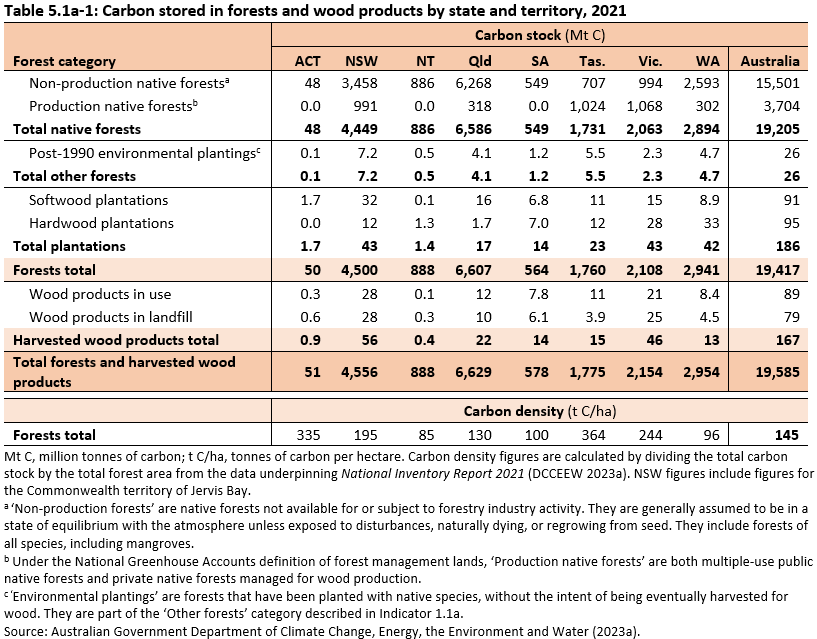
The total stock of carbon in Australia’s forests in 2021 was 19,417 million tonnes (Mt C), with 98.9% in native forests, 1.0% in plantations and 0.1% in other forest (Table 5.1a-1). Total forest carbon stock accounts for both above-ground and below-ground carbon pools. This includes carbon in living biomass of trees and other plants (both above and below ground components), in dead wood and forest litter, and carbon stored in forest soils. Other reported estimates of forest carbon stocks may vary due to the specific carbon pools included in these other estimates.
The largest forest carbon stocks are in Queensland and New South Wales, with 34% and 23% respectively of the national total. The distribution of forest carbon across jurisdictions reflects their area of forest, disturbance history, and biomass per unit area. Forests with favourable growing conditions and less frequent disturbance generally contain more biomass and therefore more carbon. Forests in Tasmania contain an average of 364 tonnes of carbon per hectare, while forests in the Northern Territory contain an average of 85 tonnes of carbon per hectare (Table 5.1a 1). Carbon dynamics in forests in New South Wales are explored further in Case study 5.1a-1.
The total forest carbon stock presented here and drawn from the datasets underpinning National Inventory Report 2021 (DCCEEW 2023a, most recent at time of analysis) is 12% less than the total forest carbon stock reported in Australia’s State of the Forests Report 2018. This lower value does not represent actual loss of forest carbon. Instead, it reflects recalculations and improvements in modelling (mostly for soil carbon) carried out for the more recent National Inventory Report 2021, which are applied across the whole time-series. Actual change of forest carbon stock over time is presented in Table 5.1a-2. Details of the revisions to the data are in the National Inventory Report 2021.
In 2021, the total stock of carbon in harvested wood products was 167 million tonnes (Table 5.1a 1). This includes both wood products in use and wood products in landfill in Australia. The largest carbon stocks in harvested wood products are in New South Wales and Victoria, with 34% and 27% respectively of the national total.
Click here for a Microsoft Excel workbook of the data for Table 5.1a-1.
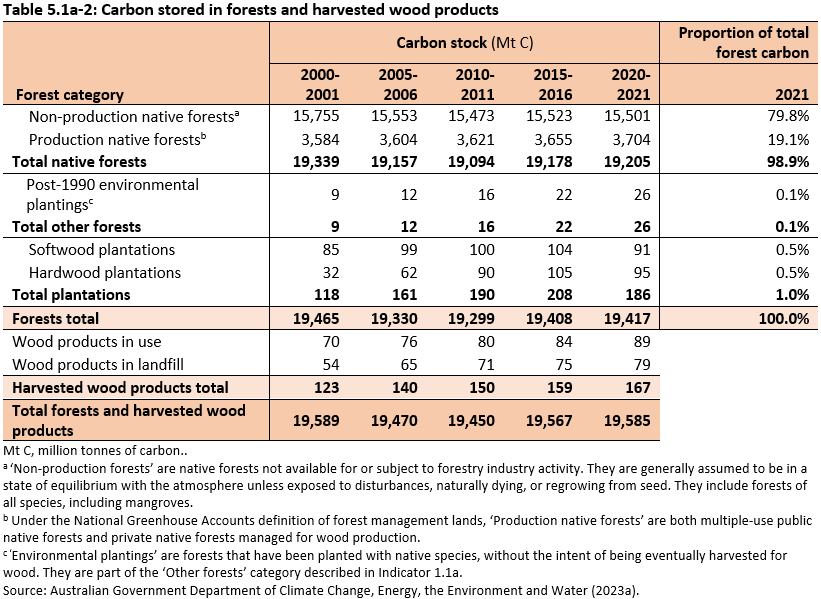
The total stock of carbon in Australia’s forests (19,417 million tonnes) in 2021 was 9 million tonnes (0.05%) larger than in 2016 (Table 5.1a 2). The total stock of carbon in harvested wood products in 2021 (167 million tonnes) was 8 million tonnes (5%) larger than in 2016.
Since 2001, the total stock of carbon in Australia’s forests nationally has decreased by 48 million tonnes (0.2%), while the stock of carbon in harvested wood products has increased by 44 million tonnes (36%).
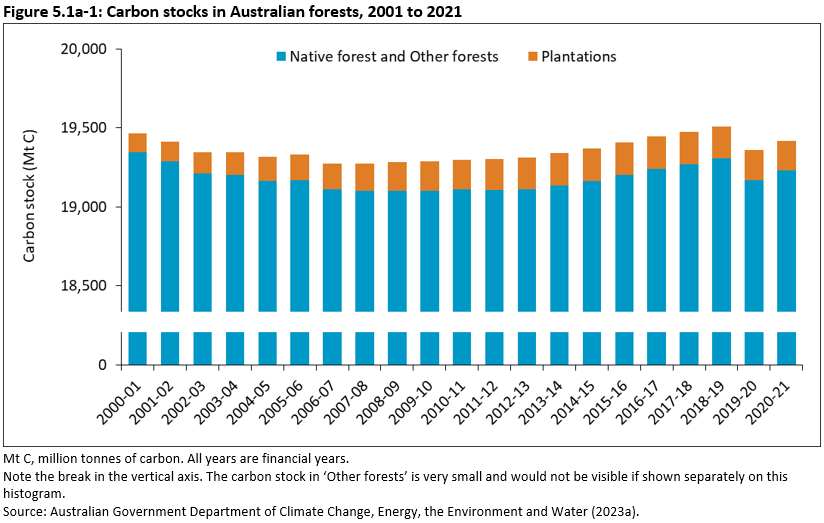
Over the period 2001-2021, total forest carbon has varied by less than 0.5% from its long-term average (Figure 5.1a-1). Forest carbon decreased slowly and progressively from 2001 to 2008, then progressively increased, tracking a similar trend in forest area (Indicator 1.1a-iv, Figure 1.1a.iv-1). The one-year reduction in forest carbon in 2020 reflects the extensive 2019-20 ‘Black Summer’ bushfires in southern and eastern Australia, when 850 million tonnes of CO2 were emitted (DISER 2020), but carbon stock recovery had commenced by 2021.
Since 2001, carbon stocks have increased in plantations and public and private native forests managed for wood production, and decreased in non-production native forests (Table 5.1a-2). This reflects the generally younger age-classes and more rapid carbon assimilation in plantations, both softwood and hardwood, established in the decade from 2000 and post-harvest regeneration in public and private native forests managed for wood production. Changes in the carbon stock of hardwood plantations also reflect changes in hardwood plantation area over time.
Click here for a Microsoft Excel workbook of the data for Table 5.1a-2.
Click here for a Microsoft Excel workbook of the data for Figure 5.1a-1.
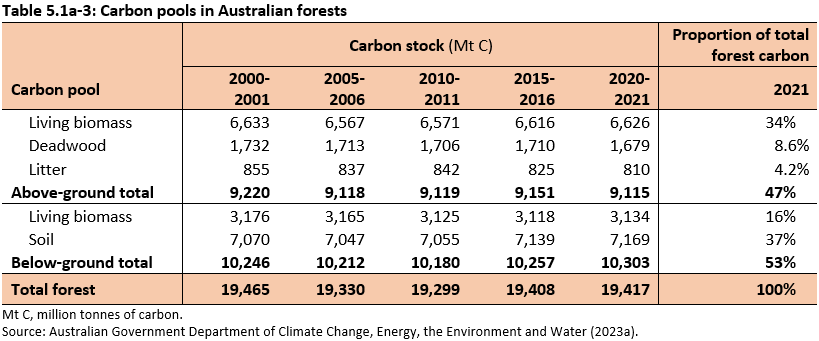
Various pools of carbon in forests comprise the total forest carbon pool (Table 5.1a-3). On average, more than half (53%) of Australia’s forest carbon is below-ground, in roots and organic matter in soils. Above-ground carbon is dominated by carbon in the living biomass in trees and other organic material, and in deadwood and litter.
The ratios between these pools vary with forest age and disturbance history. For example, the transition in Tasmania from mixed eucalypt forest to rainforest in the absence of fire is associated with a loss of carbon from the site as smaller rainforest trees replace larger eucalypts (Moroni et al. 2017). The loss occurs only in above-ground biomass, as there is no concurrent change in below-ground biomass (McIntosh et al. 2020).
Click here for a Microsoft Excel workbook of the data for Table 5.1a-3.
Australia’s emissions of greenhouse gases resulting from human activities are reported by the Australian Government Department of Climate Change, Energy, the Environment and Water (DCCEEW) through the National Inventory Report series. Emissions are reported by industry sector, using the common unit of ‘carbon dioxide equivalent’, abbreviated as CO2-e. Reporting for the Land use, land use change and forestry (LULUCF) sector covers greenhouse gas emissions and sequestration associated with management practices that affect carbon stores in vegetation and soils.
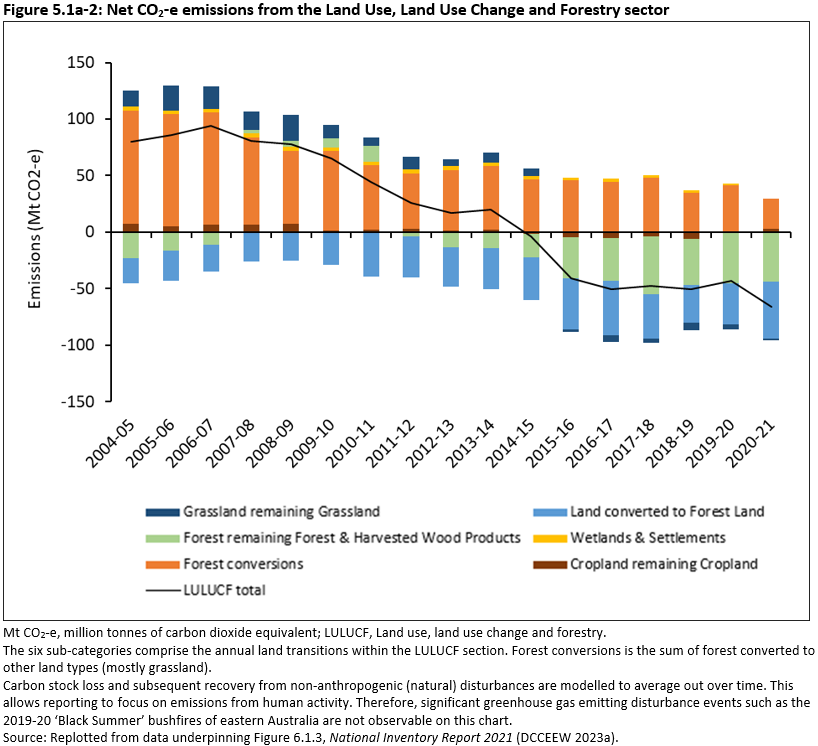
Emissions from the LULUCF sector have been decreasing since 2006-07, and since 2015-16 the sector has been a net sink absorbing more carbon dioxide than is emitted (Figure 5.1a-2). This trend has been driven by various changes across the LULUCF reporting components including:
- a decline in emissions from land clearing of forests for agriculture (reported on Figure 5.1a-2 under ‘Forest conversions’)
- a decline in emissions from harvesting of native forests, and increased sequestration by forests regrowing after harvest (reported under ‘Forest remaining Forest & Harvested Wood Products)
- increased sequestration through forest regrowth on previously cleared land (reported under ‘Land converted to Forest Land’)
- ongoing sequestration in harvested wood products (reported under ‘Forest remaining Forest & Harvested Wood Products’).
Click here for a Microsoft Excel workbook of the data for Figure 5.1a-2.
The ‘Forest remaining Forest’ and ‘Harvested Wood Products’ components together sequestered a total of 43.8 million tonnes carbon dioxide-equivalent (Mt CO2-e) in 2020-21 (Figure 5.1a-2) (DCCEEW 2023a).
Harvested native forests are reported as part of the ‘Forest remaining Forest’ component. Summing emissions from native forest harvesting events and sequestration in regrowing forest, harvested native forests provided a net sink of 35.7 Mt CO2-e. For comparison, this figure is equivalent to 8% of Australia’s total greenhouse gas emissions that year. The rate of sequestration by forest regrowing after previous harvesting will reduce over time as existing regrowth forests mature (as a forest matures growth slows and therefore less carbon is sequestered), and as fewer regrowth forests are created by harvesting.
The net sink in ‘Harvested Wood Products’ in 2021 was 4.9 Mt CO2-e (DCCEEW 2023a).
The remaining 3.2 Mt CO2-e of removals from ‘Forest remaining Forest’ comprise the net sink resulting from emissions and removals from plantations, consumed fuelwood, bushfires and prescribed fires (DCCEEW 2023a).
Carbon emissions are also associated with combustion of woody biomass (including fuelwood from native forests) for human use. In 2021-22, wood and wood waste containing 2.1 Mt C was combusted, with a gross calorific value of 86.6 petajoules (PJ) of energy. Wood and wood waste was consumed both in the residential sector (1.2 Mt C) and the manufacturing sector (0.6 Mt C) (DCCEEW 2023b) (see also Indicator 6.1d). However, the use of a renewable fuel such as wood instead of a fossil fuel will lead to lower net emissions per unit of energy when the carbon sequestered by regrowth of the forest that produced the wood is also considered.
Forest harvesting events are associated with net emissions at the harvest site, however, as the forest regrows carbon is sequestered back on the site and carbon is also stored in wood products harvested from the site. Modelling undertaken by New South Wales Department of Primary Industries, Forest & Wood Products Australia, and others in various forest regions in eastern Australia, have shown little difference in net carbon sequestered over a 100-year period between forest managed for wood production and forest managed solely for conservation (FWPA 2023), although modelling outcomes depend on the selected scope (system boundaries) as well as choice of variables and accounting frameworks (Ximenes 2021). Modification of forest management practices or harvest rotations, increased use of forest residues, use of wood as a substitute for fossil fuels and for greenhouse gas-intensive materials such as steel and concrete, and reforestation of cleared land all have the potential for further reduction of emissions and increased sequestration as part of the contribution of Australia’s forests and of forest industries to the global carbon cycle (Ximenes 2021, Allen 2022, Davis 2023).
Research to quantify the carbon balance of New South Wales forests has found forest carbon stocks generally declined from the mid-1990s. The research undertaken by FLINTpro, CSIRO and New South Wales Department of Primary Industries aimed to simulate the contribution of New South Wales forests to regional and global carbon cycles and identify opportunities to enhance carbon storage in NSW forests.
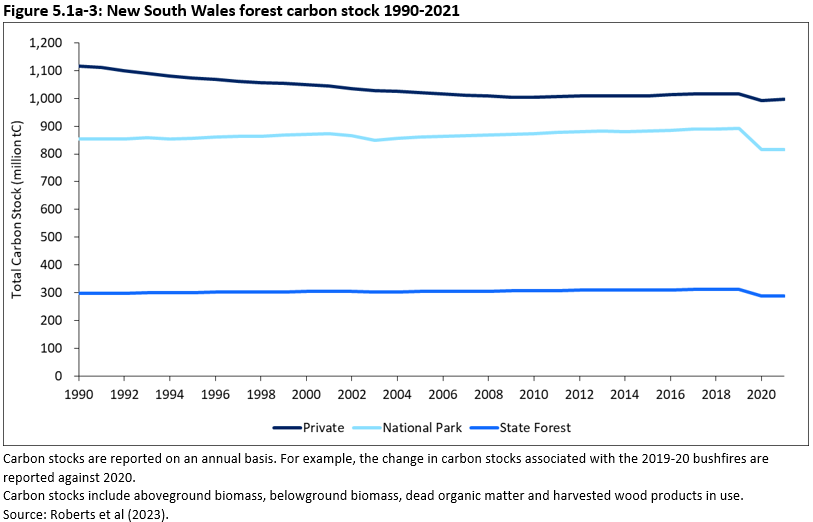
Forest carbon stock in New South Wales generally declined from 1990 through to the mid-2000s, after which stocks increased through to 2019, prior to the bushfires of the summer of 2019-20 (Figure 5.1a-3). Between 1990 and 2021, New South Wales forests lost an estimated 165 million tonnes of carbon, with most of this loss due to the 2019-20 bushfires.
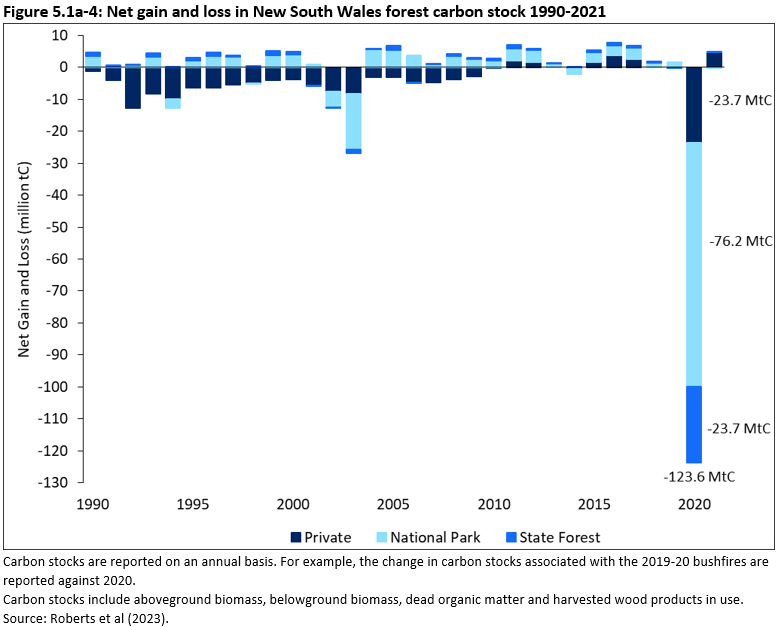
The magnitude of the disturbance caused by the 2019-20 bushfires is highlighted in Figure 5.1a-4, as are the slight increase in stocks in 2021 due to post-fire regrowth. The total carbon stock of forests in New South Wales at the end of the assessment period (2021) was calculated to be 2.1 billion tonnes of carbon, which is 165 million tonnes of carbon less than the calculated balance in 1990 at the start of the assessment period.
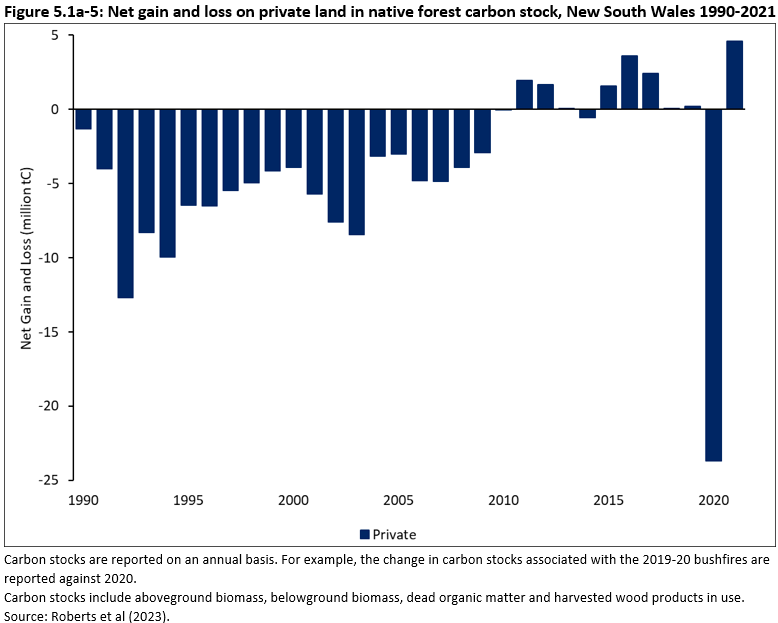
Both gains and losses in forest carbon stock occurred on all tenures from 1990 to 2021, including significant loss events, particularly due to fire. Consistent annual losses of forest carbon stock occurred on privately managed land up to 2009 that did not occur on the public land tenures. Changes in native vegetation management regulations on private land reduced the area of native forest cleared and led to reduced losses and small net gains in private forest carbon stocks in subsequent years, excluding the fire related net losses in 2020 (Figure 5.1-5). The privately managed land referred to includes small areas of forest on other tenures (e.g. other Crown land, Indigenous Protected Areas).
Drivers of carbon stock changes in New South Wales forests
Carbon stock within New South Wales forests is subject to change due to both natural disturbances (fire, drought, natural regeneration) and anthropogenic activities (land clearing, reforestation, prescribed fire, and timber harvesting in public native forests and commercial plantations).
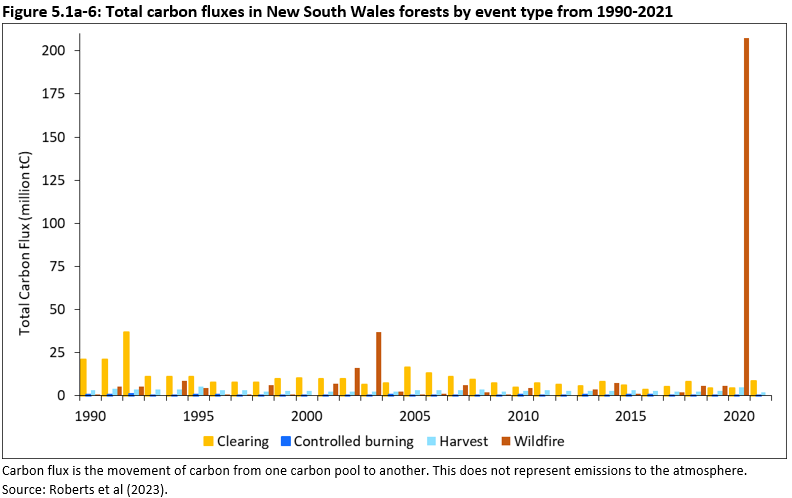
The most significant impacts on New South Wales forest carbon stocks during the assessment period were from large bushfire events, particularly in 2020 but also in 2003 and 2002 (Figure 5.1a-6). During the assessment period, fires also accounted for 69% of carbon released to the atmosphere from live biomass and dead organic matter.
Clearing of forest on private land for agriculture was the next largest factor driving change in carbon stocks, particularly between 1990 and 2007 when fluxes from live biomass to dead organic matter ranged from 5.75 million tonnes of carbon to a high of over 33 million tonnes of carbon. Trends in the annual change in carbon stocks due to forest clearing on private land decreased after 2009 following changes in native vegetation management regulations for private land. Forest clearing here is the removal of tree cover to a level below the forest threshold (20% canopy cover). A ‘clearing’ event is defined as a forest cover loss detected in the remote sensing product that was not associated with timber harvesting activities or fire. This includes natural (e.g. drought) and human induced changes, as well as any remote sensing omission and commission errors.
Compared with fire and forest clearing on private land, movements of carbon associated with timber harvesting are relatively low (Figure 5.1a-6). Timber harvesting moves carbon from the ‘live biomass’ pool to the ‘harvested wood products in use’ pool and to the ‘dead organic matter’ pool. From here, carbon is slowly released to the atmosphere through decomposition as wood products come to the end of their usable life. At the same time, harvested forests regrow, sequestering carbon and contributing to net primary productivity.
Further information
This research was undertaken by FLINTpro, CSIRO and the NSW Department of Primary Industries, as part of the New South Wales Forest Monitoring and Improvement Program.
Reports detailing the full findings of the carbon balance assessments, as well as further information about the data sources and methodologies used, can be found on the New South Wales Natural Resources Commission website.
Data for Figure 5.1a-2 are sourced from Figure 6.1.3 in National Inventory Report 2021 (DCCEEW 2023a).
Data for ‘Forest remaining Forest’ and ‘Harvested Wood Products’ were extracted from the following tables in the National Inventory Report, Volumes 1 and 2 DCCEEW (2023a).
- Harvested native forest—Table 6.4.1 Emissions and removals from forest land remaining forest land, kt CO2 -e
- Harvested wood products—Table 6.10.1 Net emissions from harvested wood products, kt CO2 -e
Carbon emissions associated with combustion of woody biomass are drawn from Table R of the Australian Energy Update 2023 (DCCEEW 2023b).
Case study 5.1a-1 is sourced from Carbon Balance of NSW Forests – Update Report (Roberts et al 2023).
Allen C, Oldfield P, Teh SH, Wiedmann T, Langdon S, Yu M, Yang J (2022). Modelling ambitious climate mitigation pathways for Australia’s built environment, Journal of Sustainable Cities and Society 77: 103554 doi.org/10.1016/j.scs.2021.103554
Davis D, Lopez Peralta M, Keenan R, Eckard R, Brear M (2023). Downscaling – The role of forestry in enhancing the Australian land CO2 sink, Net Zero Australia.
DCCEEW (Department of Climate Change, Energy, the Environment and Water) (2023a). National Inventory Report, Volumes 1 and 2. Australian Government Department of Climate Change, Energy, the Environment and Water, Canberra.
DCCEEW (Department of Climate Change, Energy, the Environment and Water) (2023b). Australian Energy Update 2023, Australian Government Department of Climate Change, Energy, the Environment and Water, Canberra.
DISER (Department of Industry, Science, Energy and Resources) (2020). Estimating greenhouse gas emissions from bushfires in Australia's temperate forests: focus on 2019-20. Technical Update, Australian Government Department of Industry, Science, Energy and Resources, Canberra. CC By 4.0.
FWPA (Forests & Wood Products Australia) (2022). Forests, Plantations, Wood Products & Australia’s Carbon Balance, Ximenes F, Thinkstep-anz & FWPA. fwpa.com.au/resources/
Roberts G, Hislop S, Johnson T, Fitzgerald E (2023). Carbon Balance of NSW Forests – Update Report, NSW Natural Resources Commission.
McIntosh PD, Hardcastle JL, Kloffel T, Moroni M, Santini T (2020). Can carbon sequestration in Tasmanian “wet” eucalypt forests be used to mitigate climate change? Forest succession, the buffering effects of soils, and landscape processes must be taken into account, International Journal of Forestry Research 2020:1 doi.org/10.1155/2020/6509659
MIG (Montreal Process Implementation Group for Australia) and MFISC (National Forest Inventory Steering Committee) (2018). Australia’s State of the Forests Report 2018, ABARES, Canberra, December. CC By 4.0.
Moroni MT, Musk R, Wardlaw TJ (2017). Forest succession where trees become smaller and wood carbon stocks reduce, Forest Ecology and Management 393: 74-80 doi.org/10.1016/j.foreco.2017.02.051
Ximenes F (2021). Carbon dynamics in native forests – a brief review, NSW Department of Primary Industries. doi.org/10.13140/RG.2.2.29994.54725

