Context
In international trade forums, emissions intensity statistics from FAOSTAT and OECD are widely used. This website provides balance, improving those statistics, which are confronted by challenges such as one-size-fits-all methodologies to calculating emissions, attributing emissions from multiple product production systems, and in the expression of emissions per dollar estimates (these are discussed below).
For consistency with discussions in international trade forums, the emissions intensities on this site are based on the categorisations in the FAOSTAT methodology (FAOSTAT 2023). The categorisations of emissions that are included and excluded here are summarised in the methodology section of this webpage. The use of these categorisations are designed to allow comparisons to existing data sources. They are narrower in coverage than other standard approaches used in Australia such as the Common Approach to GHG Accounting and life cycle analysis which include a broader range of activities, such as land-use changes, on-farm energy use and transportation.
Emissions intensity
An ‘emissions intensity’ measures the emissions that are produced per unit of activity. For example, the emissions of greenhouse gases produced per tonne of grain produced, or per head of cattle. Emissions intensities are useful means to compare the environmental impact of the same activities across different countries. Countries with a lower emissions intensity produce less emissions for the same level of activity than countries with a higher emissions intensity. This page makes available on-farm emissions intensity estimates for different types of agricultural activities across countries.
A basket of agricultural commodities
One way of comparing agricultural emissions intensities across countries is to explore how emissions differ for an identical basket of output. The graph below shows the on-farm emissions from cattle, wheat, maize and rice production at the countries’ average emissions intensities of those commodities. In this example, the basket simulates each country producing 1% of global production of wheat, rice, maize and cattle (for beef and dairy).
Indicative agricultural emissions of a basket of major agricultural commodities (3-year average, 2018-2020)
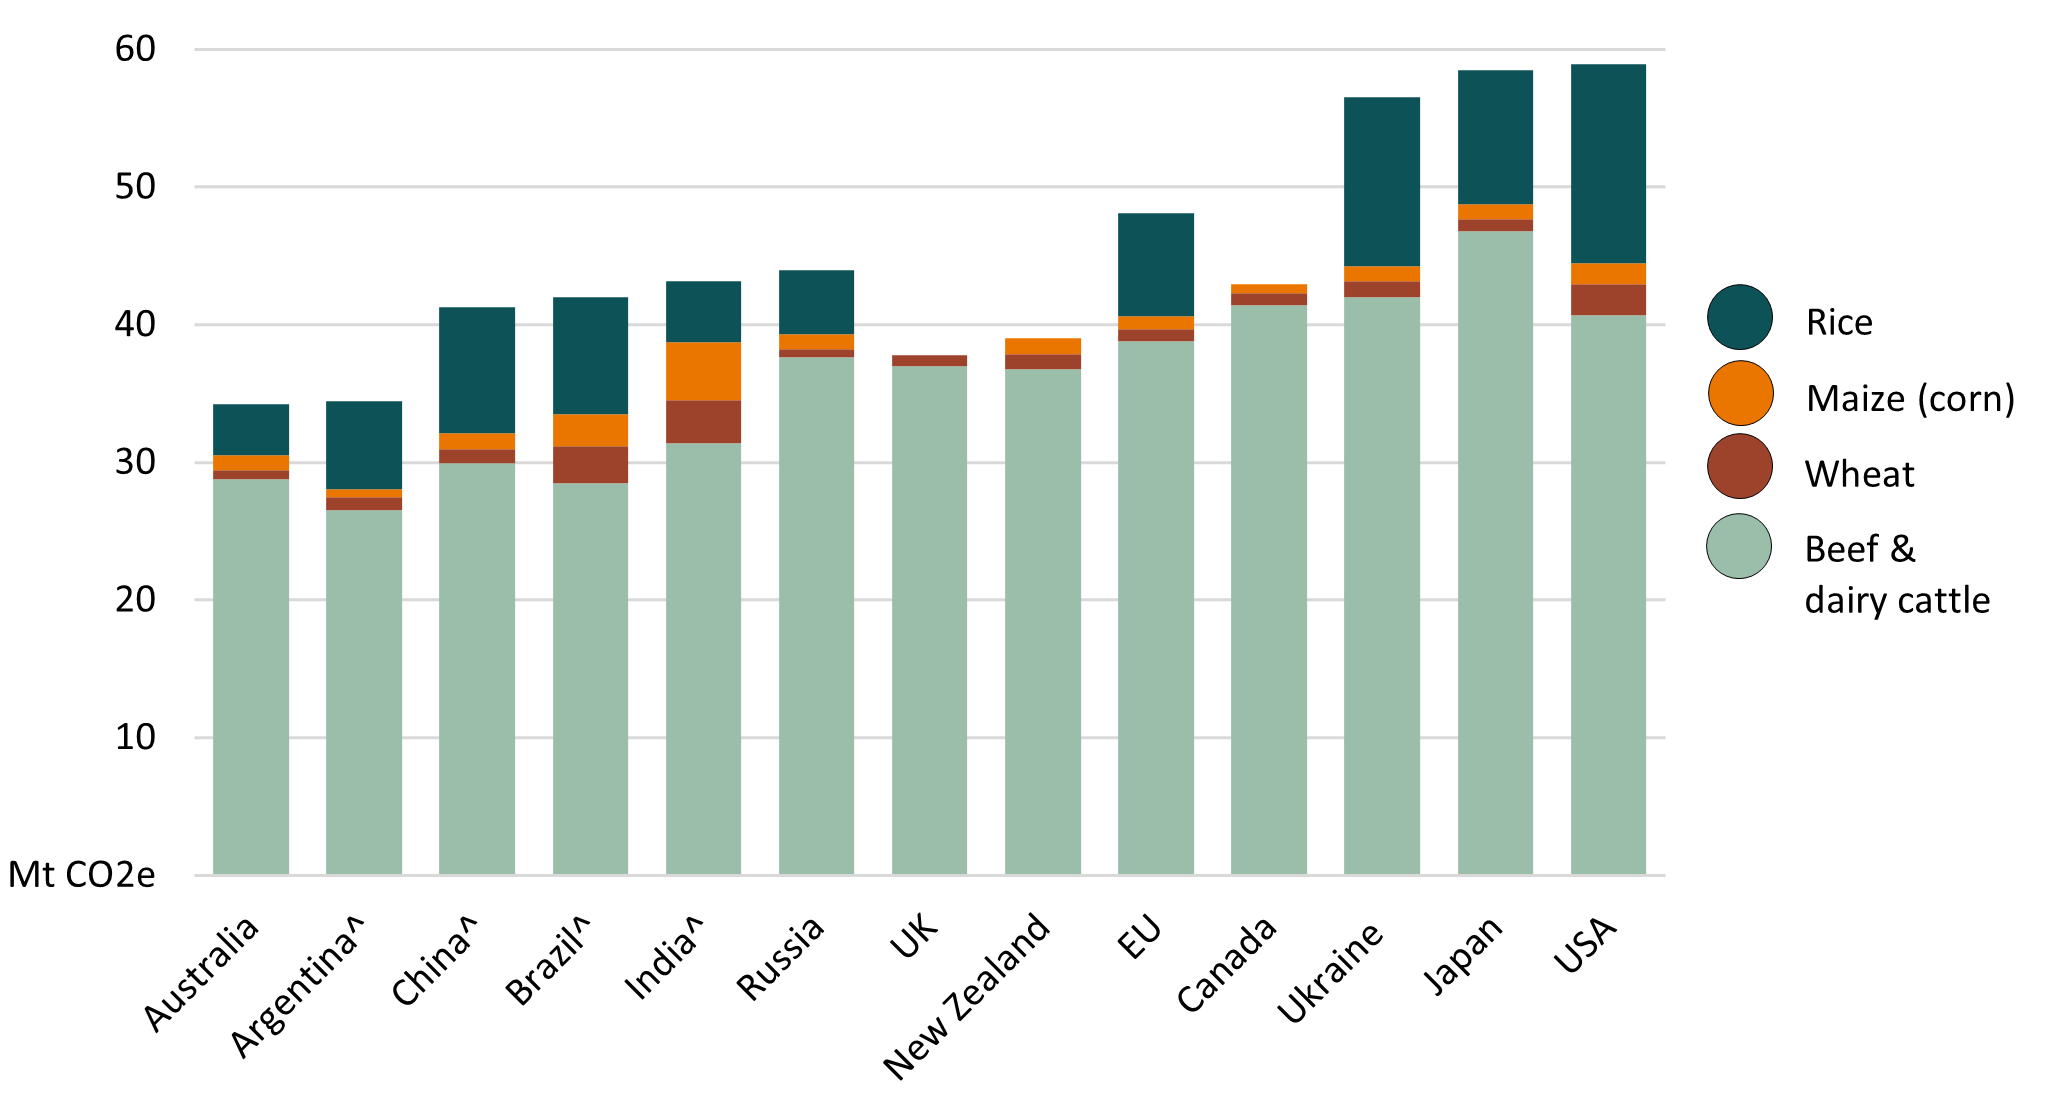
Note: Emissions data from UNFCCC, except where noted. Commodity basket represents 1% of global production of wheat, rice, maize and cattle. ^Calculated using Tier 1 methodology per the 2019 refinement to the 2006 IPCC guidelines. Tier 1 emissions calculations are explained in the methodology section below. *Rice data unavailable for Canada, New Zealand and United Kingdom. Maize data unavailable for United Kingdom.
Download
Table data (XLSX 49 KB)
Chart image (PNG 66 KB)
If you have difficulty accessing these files, visit web accessibility for assistance.
Estimates of emissions intensities from individual commodity production include an emissions and production component, both of which can be measured in physical mass. When expanding this to estimate the emissions intensity of the entire agricultural sector, a question arises of how to aggregate the production of many different types of commodities together. One way to account for this is to measure production on a value basis, delivering an emissions per dollar figure. This method introduces a price component into the calculation because value of production is defined as the quantity of production multiplied by the prices received at the farmgate.
There are several ways that the introduction of a price component can bias the results without any bearing on the physical emissions intensity of an agricultural process. The price component can lead to significantly different relative emissions intensities between countries, compared with emissions intensities using physical activity units. This reflects the influence of the four points outlined below.
Agricultural support
The inclusion of agricultural support falsely improves emissions intensities because it includes “value” that is not generated from emissions-generating processes on farm.
Competitiveness
A less competitive country will have higher prices, leading to lower emissions intensity, even if it is a high emissions producer.
Exchange rates
Emissions intensity data are typically reported in emissions per US dollar. Changes in the exchange rate will therefore affect emissions per dollar, even when the country’s physical emissions intensity has not changed.
Production mix
A country may produce a majority of low-value products, e.g. low-value grains, leading to a higher emissions per dollar. This may be the case even if it is actually a low emissions producer per physical unit of output.
Agricultural emissions intensities calculated on a value basis can present a misleadingly different picture (3-year average, 2019-2021)
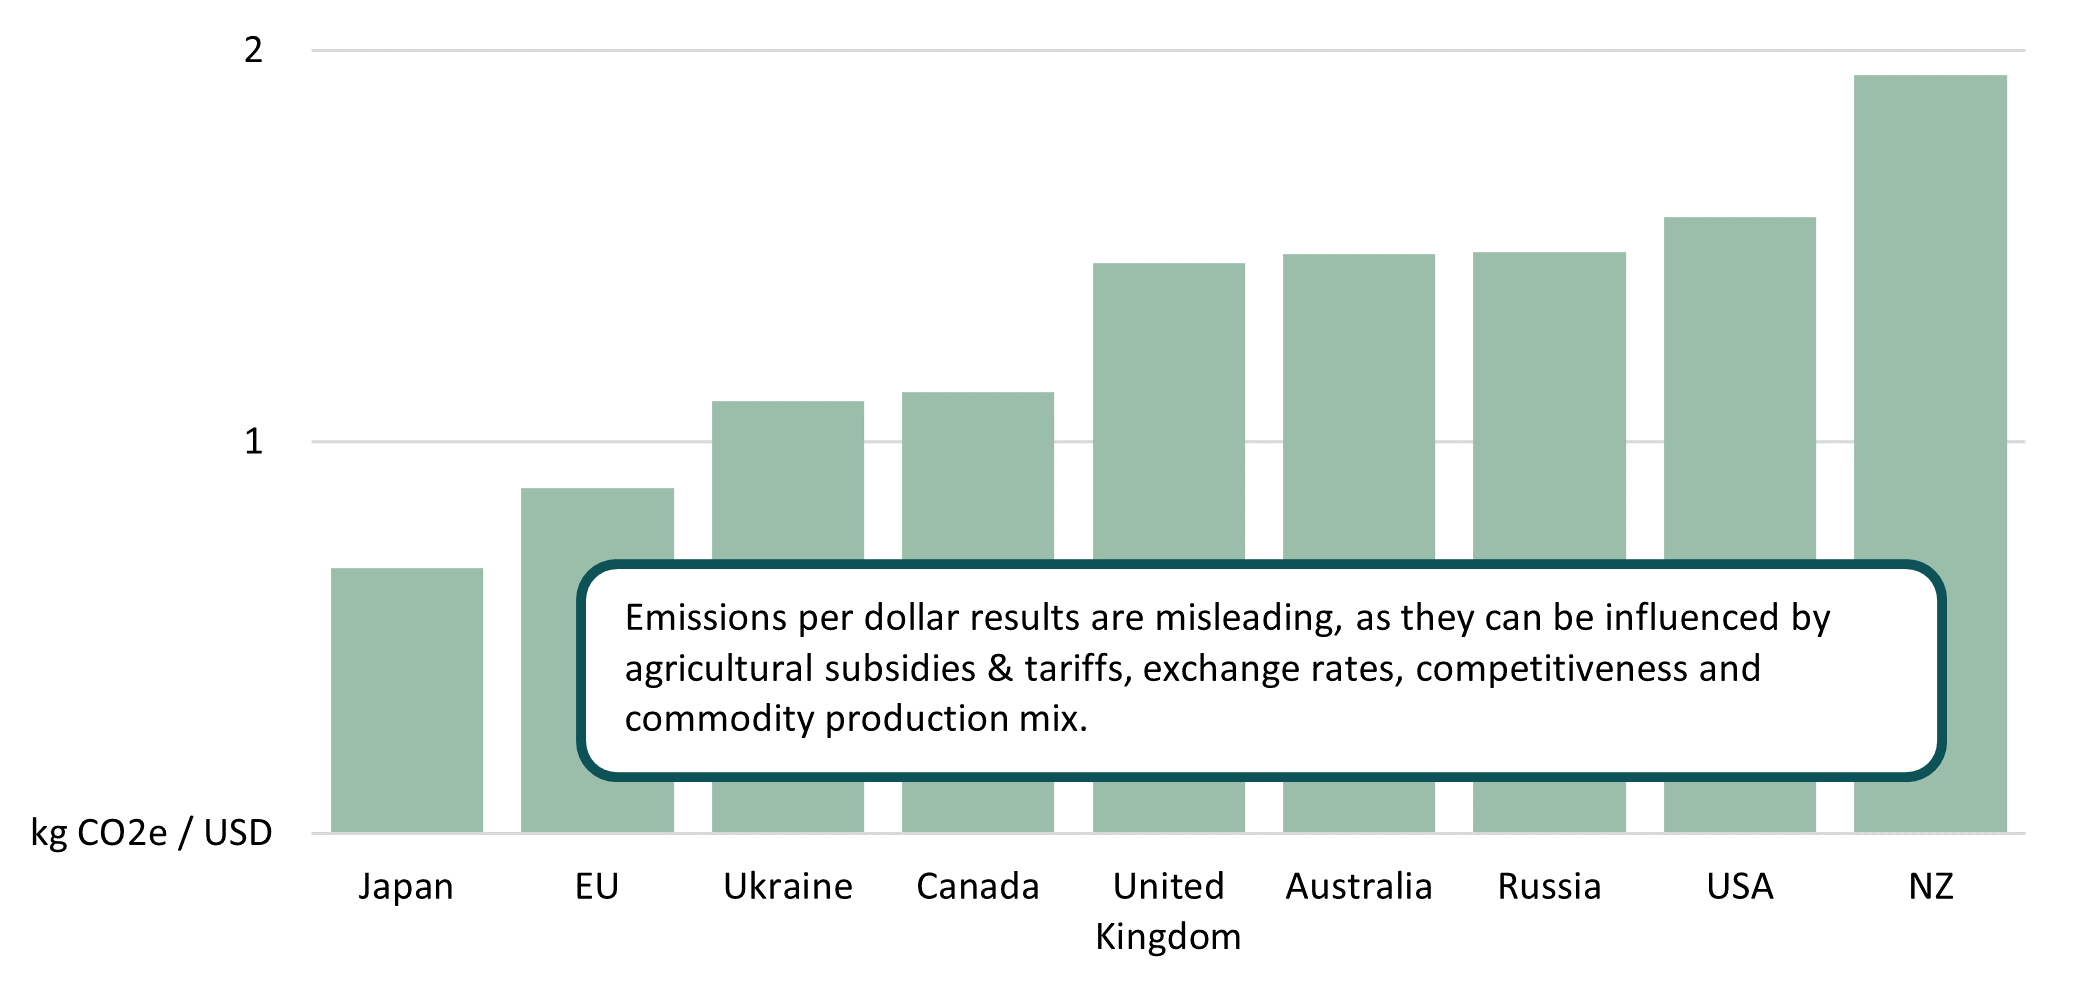
Note: excludes effects of land-use choices. Value of production adjusted for producer support.
Cattle
Livestock emissions are best shown by focussing on emissions per animal. Alternative sources of emissions intensity statistics can underestimate the emissions intensity of beef for countries with large dairy herds. This is due to the differentiation of cattle into either dairy or beef animals. The emissions in alternative statistics for dairy products may only include emissions produced from dairy animals and emissions for beef may only include emissions from speciality beef animals. However, beef production includes both production from specialty beef animals and retired dairy animals. This means countries with large dairy herds will typically have a sizeable amount of “emissions free” beef production for which the corresponding emissions do not flow into a beef emissions intensity calculation.
Cattle emissions intensity (5-year average, 2017-2021)
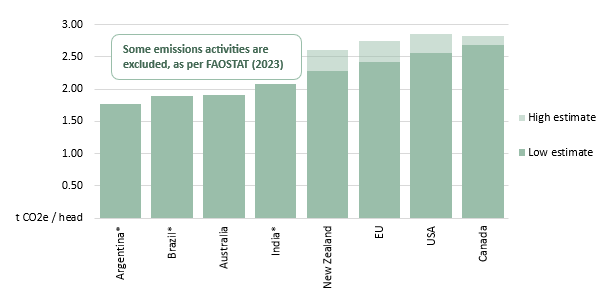
Note: An asterisk (*) indicates countries for which calculations of greenhouse gas emissions are based on Tier 1 default factors per the 2019 refinement to the 2006 IPCC guidelines. Tier 1 emissions calculations are explained in the methodology section below. Low estimates and high estimates are provided for some countries as cattle-specific emissions data are not available for some components of cattle emissions, instead components are only available for all livestock
Download
Table data (XLSX 45 KB)
Chart image (PNG 60 KB)
Cattle emissions intensity data (XLSX 644 KB)
If you have difficulty accessing these files, visit web accessibility for assistance.
Sheep
Emissions intensities for livestock products should generally be avoided due to the challenge of apportioning emissions to multiple outputs (e.g. lamb, wool, leather). This means they are best shown by focussing on emissions per animal.
Sheep emissions intensity (5-year average, 2017-2021)
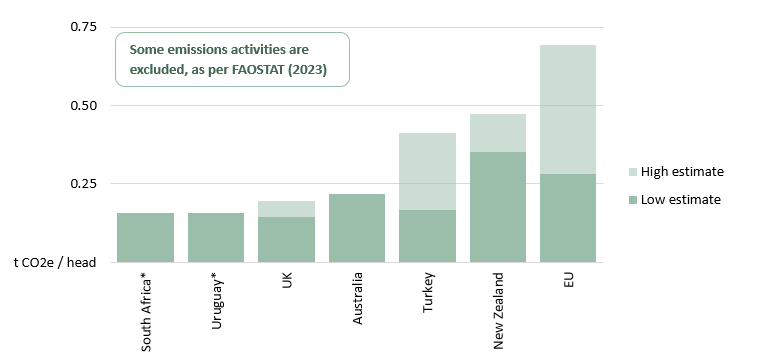
Note: An asterisk (*) indicates countries for which calculations of greenhouse gas emissions are based on Tier 1 default factors per the 2019 refinement to the 2006 IPCC guidelines. Low estimates and high estimates are provided for some countries as sheep-specific emissions data are not available for some components of sheep emissions, instead components are only available for all livestock.
Download
Table data (XLSX 42 KB)
Chart image (PNG 51 KB)
Sheep emissions intensity data (XLSX 575 KB)
If you have difficulty accessing these files, visit web accessibility for assistance.
Grains
Grains emissions intensity (5-year average)
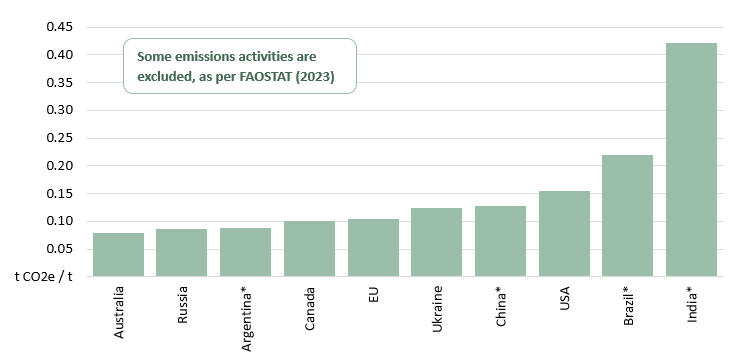
Note: Excludes rice. An asterisk (*) indicates countries for which calculations of greenhouse gas emissions are based on Tier 1 default factors per the 2019 refinement to the 2006 IPCC guidelines. Production bundles differ by country, but similarities in production processes allow comparison across grain types.
Download
Table data (XLSX 35 KB)
Chart image (PNG 40 KB)
Grains emissions intensity data (XLSX 283 KB)
If you have difficulty accessing these files, visit web accessibility for assistance.
Maize/corn
Maize/corn emissions intensity (5-year average)
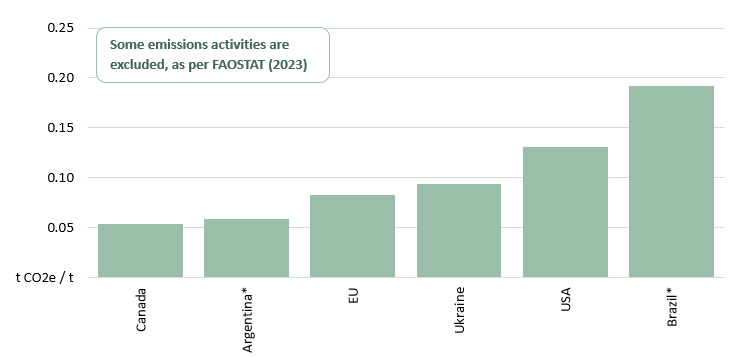
Note: An asterisk (*) indicates countries for which calculations of greenhouse gas emissions are based on Tier 1 default factors per the 2019 refinement to the 2006 IPCC guidelines.
Download
Table data (XLSX 31 KB)
Chart image (PNG 34 KB)
Maize emissions intensity data (XLSX 232 KB)
If you have difficulty accessing these files, visit web accessibility for assistance.
Rice
Methane emissions associated with the inundation of rice fields account for most emissions from rice production. For example, in Australia, where detailed data are available, these methane emissions accounted for 86% of total emissions for rice between 2012 and 2021. In the calculations below, only methane emissions directly arising from rice cultivation (i.e. the methane emitted from the anerobic decomposition of organic matter in rice paddy fields) are included. Emissions from fertiliser use, crop residues and burning are all excluded due to challenges associated with obtaining accurate rice-specific data for many countries.
Rice emissions intensity (5-year average)
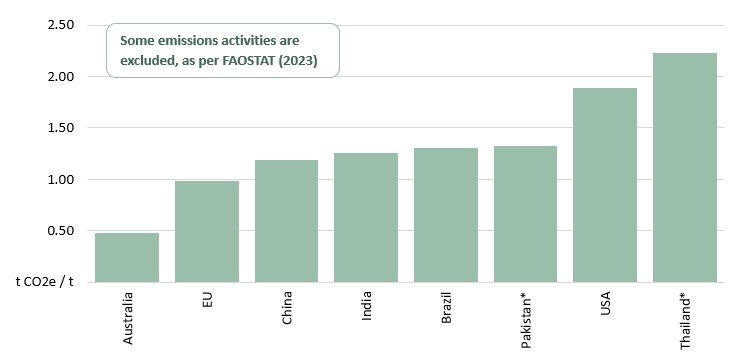
Note: An asterisk (*) indicates countries for which calculations of greenhouse gas emissions are based on Tier 1 default factors per the 2019 refinement to the 2006 IPCC guidelines.
Download
Table data (XLSX 185 KB)
Chart image (PNG 36 KB)
Rice emissions intensity data (XLSX 235 KB)
If you have difficulty accessing these files, visit web accessibility for assistance.
Wheat
Wheat emissions intensity (5-year average)
Note: An asterisk (*) indicates countries for which calculations of greenhouse gas emissions are based on Tier 1 default factors per the 2019 refinement to the 2006 IPCC guidelines.
Download
Table data (XLSX 34 KB)
Chart image (PNG 39 KB)
Wheat emissions intensity data (XLSX 235 KB)
If you have difficulty accessing these files, visit web accessibility for assistance.
Methodology
An ‘emissions intensity’ measures the emissions that are produced per unit of activity. In the case of individual commodities (i.e. cattle, sheep, grains, maize/corn, rice, wheat) this calculation is done on a physical product basis. Details are available in Fell & Creed (2023).
Data on emissions intensities produced elsewhere may use Tier 1 methodology emissions data. Tier 1 methodology involves utilising global one-size-fits-all (or regional one-size-fits-all) values to calculate CO2 emissions, so does not necessarily take into account local environments and production systems. On this webpage, tier 1 methodology is only used to calculate emissions intensity for countries which do not regularly report their emissions inventory to the UNFCCC. In these instances, the methodology specified in the 2019 Refinement to the 2006 IPCC Guidelines for National Greenhouse Gas Inventories was used.
The emissions and production data used is crucial to generating reliable estimates of emissions intensity. The emissions statistics on this page use data from official submissions of greenhouse gas emissions/removals by countries that are parties to the United Nations Framework Convention on Climate Change and are sourced directly from the UNFCCC secretariat (unless specified otherwise). These data provide a more accurate basis to calculate emissions intensities specific to individual countries. Commodity production data are sourced from the FAO for individual commodities and value of production data are sourced from the OECD for total agriculture.
The emissions activities included and excluded for each commodity are found below, with a technical specification documented in Fell & Creed (2023). Due to these statistics excluding some emissions activities, it is likely that these statistics show lower emissions intensities, on a global average level, relative to other methodologies.
The code to reproduce the data is available at the below links:
Download
Code for livestock (zip 68 KB)
Code for crops (zip 2.2 MB)
If you have difficulty accessing these files, visit web accessibility for assistance.
Emissions activities included and excluded in the estimates
The emissions activities included in the calculations for grains (excluding rice), wheat and maize (corn) are:
- Direct nitrous oxide emissions associated with inorganic fertilisers (IPCC category 3.D.1.a, as reported by UNFCCC)
- Direct nitrous oxide emissions associated with crop residues (3.D.1.d)
- Nitrous oxide emissions associated with field burning (3.F)
- Methane emissions associated with field burning (3.F).
Notable exclusions from grains emissions calculations are indirect emissions associated with inorganic fertilisers and crop residues (3.D.2), liming (3.G), and urea CO2 emissions (3.H), land use changes (4) and organic fertiliser application (3.D.1.b).
The emissions activities included in the calculation for rice are:
- Methane emissions associated with rice cultivation (flooding of rice paddies) (3.C).
Notable exclusions from rice emissions calculations are emissions associated with inorganic fertilisers (3.D.1.a) and crop residues (3.D.1.d), field burning (3.F), liming (3.G), and urea application (3.H).
The emissions activities included in the calculations for livestock are:
- Methane emissions associated with enteric fermentation (3.A)
- Nitrous oxide emissions associated with manure management (3.B)
- Nitrous oxide emissions associated with manure applied to soils (3.D.1.b.i)
- Nitrous oxide emissions associated with Urine and dung deposits by grazing animals (3.D.1.c).
Notable exclusions from livestock emissions calculations are emissions associated with land use changes (4) or those associated with growing of livestock feed crops.

