Authors: Dale Ashton and Jeremy van Dijk
The Murray–Darling Basin accounts for about three-quarters of Australia’s citrus, pome fruit (that is, fruit with a core of several small seeds such as apples and pears) and stone fruit production. A large percentage of these crops are grown in the southern Basin.
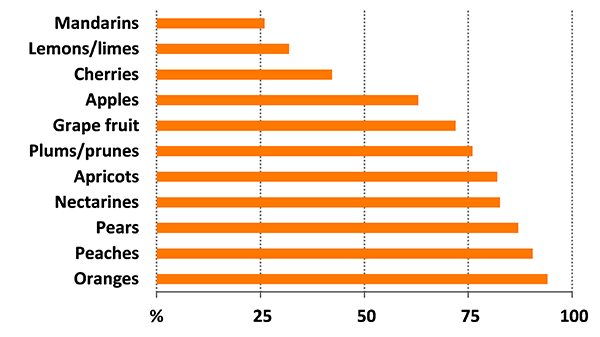
In 2010–11 around 74 per cent, 70 per cent and 83 per cent of Australia’s citrus, stone fruit and pome fruit, respectively, were grown in the Basin (ABS 2012). Figure 1 shows shares of total production for individual fruit types.
[expand all]
Horticulture production in the Murray–Darling Basin
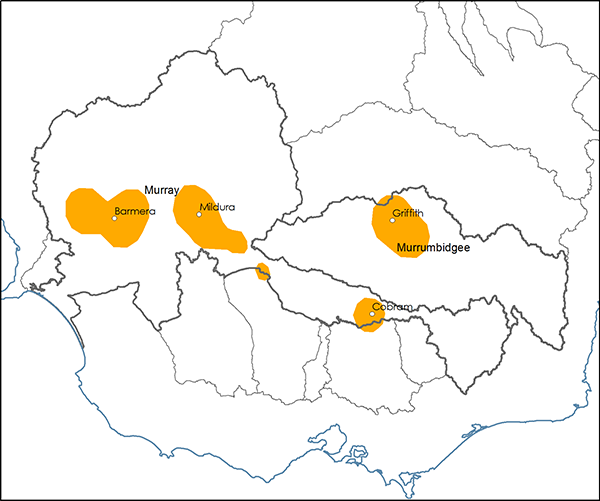
In the southern Basin, citrus (particularly oranges) is mainly produced in the Murrumbidgee region around Griffith and Leeton, and in the Murray region around Mildura and Barmera in the South Australia Riverland (Map 1).
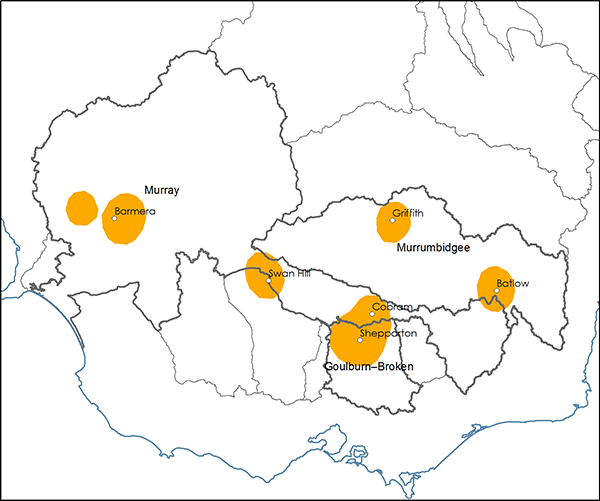
Pome fruit in the southern Basin are grown around Batlow (Murrumbidgee region) and the Goulburn Valley (Goulburn–Broken region). Stone fruit are grown in the Goulburn Valley and in the Murray region around Swan Hill, Renmark and other centres (Map 2). Many farms grow both pome fruit and stone fruit.
The Australian Bureau of Statistics recorded 1,125 specialist citrus farms in the 2010–11 agricultural census, down by around 20 per cent from the previous census in 2005–06 (ABS 2012) (Table 1). The number of specialist stone fruit farms declined by around one-third over the same period. The number of specialist pome fruit farms was stable between 2005–06 and 2010–11.
| Crop type | Unit | 2005–06 | 2010–11 |
|---|---|---|---|
| Citrus | no. | 1,387 | 1,125 |
| Pome fruit | no. | 679 | 683 |
| Stone fruit | no. | 1,276 | 851 |
Sources: ABS 2008, 2012
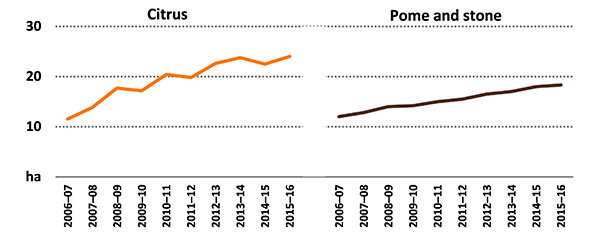
As in most established agricultural industries, citrus, pome fruit and stone fruit farm numbers in Australia have followed a general long-term downward trend. At the same time, the average area of crops grown has increased as small-scale farms exited the industry and those remaining expanded their operations (APAL 2015; Citrus Australia Ltd 2013). For example, between 2003 and 2011 around 18 per cent of citrus growers left the industry and average citrus area increased by about 15 per cent (Citrus Australia Ltd 2013). Figure 2 shows an upward trend in average crop areas per farm between 2006–07 and 2015–16. Average crop areas for pome/stone fruit farms also increased over the survey period.
average per farm
Source: ABARES Murray–Darling Basin Irrigation Survey
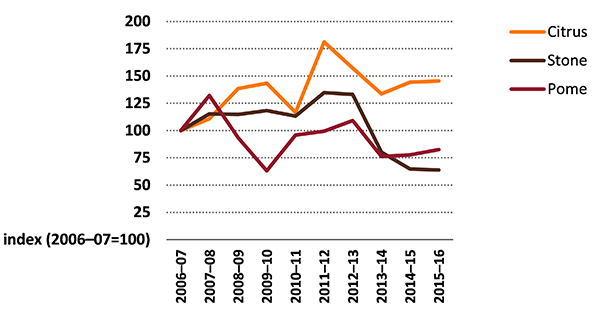
Yearly variations in citrus, pome fruit and stone fruit production since 2006–07 are shown in Figure 3. The production estimates for the southern Basin survey regions are expressed as indexes using 2006–07 as the base year. Citrus production trended upwards from 2006–07, while pome fruit production mostly trended downwards. Stone fruit production fell sharply in 2013–14 after a period of relative stability.
Yearly variations in production are highly influenced by seasonal conditions. For example, unusual frosts or heatwaves during flowering and fruit set can significantly reduce production. Prolonged drought during the early irrigation survey years resulted in low water allocations in many fruit-growing areas. Some growers elected to take a proportion of their orchards out of production during this period. In any given year the effect of water allocations and unseasonal adverse weather events on production can vary significantly between regions.
Source: ABARES Murray–Darling Basin Irrigation Survey
Crop and livestock enterprise mix
One way farmers manage changes in their farm operating environment is by adjusting the mix (or diversity) of crop and livestock enterprises each year. However, the options for citrus and pome/stone fruit growers are limited in the short term because of considerable lags between removing trees and planting new trees or starting other activities. Nevertheless, most citrus and pome/stone fruit farms produce more than one agricultural commodity, including a variety of crop and livestock outputs.
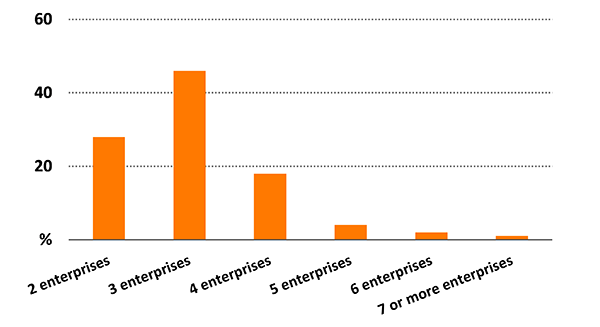
The mix of crops is important for total water use on irrigated horticulture farms. In 2014–15 an estimated 64 per cent of citrus and pome/stone fruit farms irrigated 3 or 4 individual enterprises—including tree and vine crops, pasture, hay and various other crops—28 per cent irrigated 2 crops and the remaining 8 per cent of farms irrigated 5 or more individual crop/livestock enterprises (Figure 4).
per cent of farms
Citrus and pome/stone fruit growers’ intentions
As part of the ABARES survey of irrigation farms in the Murray–Darling Basin irrigators were asked to describe what they expected to be doing in three years. These results indicate future intentions and can also be interpreted as an indicator of sentiment or industry confidence at the time of the survey.
At the time of the survey in early 2016, an estimated 70 per cent of citrus and pome/stone fruit growers indicated that their farming operations would not change in the next 3 years. This proportion has fluctuated between 45 per cent (2011–12) and 70 per cent (2014–15).
Around 25 per cent of citrus and pome/stone fruit growers indicated an intention to retire or sell their farm over the next 3 years at the time of the survey in 2016. This proportion was highest in 2010–11 and 2011–12 when around 45 per cent of growers indicated an intention to retire or sell their farm.
Over the period 2006–07 to 2014–15 citrus and pome/stone fruit growers that were intending to retire or sell their farm operated smaller farms than the average and had weaker financial performance, while those intending no change to their farming operations operated farms that were larger than the average (Table 2).
Note: Average per farm over the period 2006–07 to 2014–15. The results for ‘all other farms’ includes farms not included in the other 2 groups shown in the table.
Source: ABARES Murray–Darling Basin Irrigation Survey
Farm performance and investment
Farm performance
Farm financial performance is a key driver of change in the horticulture industry. Two measures of farm financial performance used in this report are farm cash income and rate of return.
Farm cash income is defined as total cash receipts minus total cash costs. It is a short-term measure of the cash surplus available to a farm business to reinvest or draw family income after costs have been taken into account.
Total cash receipts are the cash revenues received by a farm business. In most cases, the largest receipt items are sales of citrus, pome fruit and stone fruit. Other items include allocation water sales, contracting and government assistance payments.
Total cash costs are payments made for materials and services and include temporary water purchases, administration, crop-related expenses, interest, and permanent and casual labour. Capital and household expenses are not included in total cash costs.
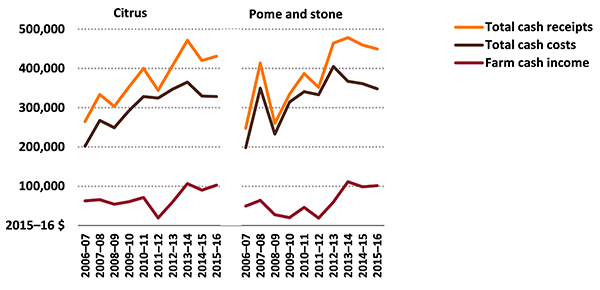
Average farm cash incomes of citrus growers (in 2015–16 dollars) rose between 2007–08 and 2010–11 as a result of improved prices for citrus and reduced expenditure on temporary water (Figure 5). Low citrus prices and many abandoned crops resulted in a sharp fall in incomes for citrus growers in 2011–12 before a recovery in 2012–13 and 2013–14. In 2014–15 average farm cash income fell by 15 per cent (in real terms) before rising by an estimated 14 per cent in 2015–16.
Average farm cash incomes of pome/stone fruit growers were less than $50,000 for 5 of the 7 years from 2006–07 to 2012–13. After a large rise in 2013–14, incomes declined by around 11 per cent in the following year. In 2015–16 average farm cash income for pome/stone fruit growers is estimated to have increased by 3 per cent (in real terms).
average per farm
Source: ABARES Murray–Darling Basin Irrigation Survey
Components of receipts
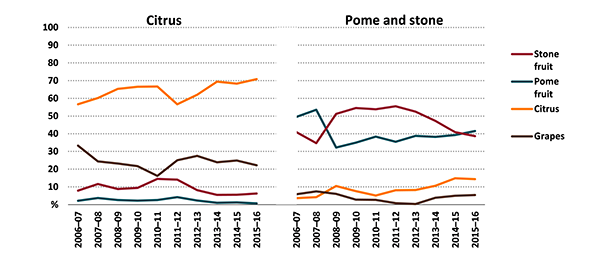
Receipts from sales of citrus were the major component of total cash receipts of citrus growers over the survey period, although receipts from grapes and stone fruit were also important (Figure 6). Receipts from sales of pome fruit and stone fruit accounted for most of the receipts of pome/stone fruit growers. A small number of pome/stone fruit farms also grew citrus and/or wine grapes.
average per farm
Source: ABARES Murray–Darling Basin Irrigation Survey
Components of costs
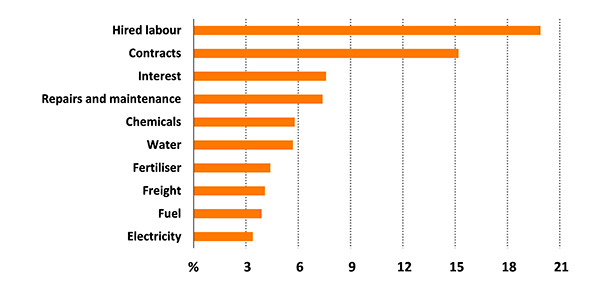
Hired labour and contracts were the major cost items on citrus and pome/stone fruit farms, accounting for 20 per cent and 15 per cent of total cash costs, respectively (Figure 7). Water (including bulk water charges and water allocation purchases) accounted for 6 per cent of total cash costs over the period 2006–07 to 2015–16, ranging from a high of 13 per cent in 2007–08—when historically low water allocations resulted in many growers purchasing water to keep trees alive—to a low of 3 per cent in 2010–11 when water was plentiful.
average per farm
Source: ABARES Murray–Darling Basin Irrigation Survey
Rate of return
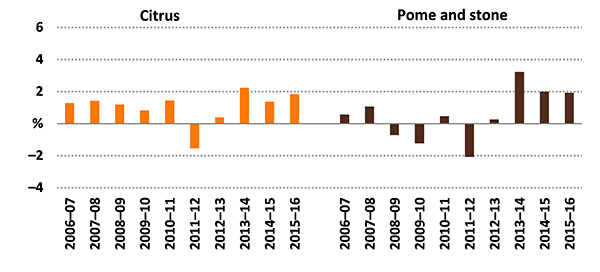
Figure 8 shows the average annual rate of return to capital (excluding capital appreciation) for citrus and pome/stone fruit farms. Rate of return is a measure of the annual profit generated by a business, expressed as a percentage of the value of the capital used to generate that profit. Because it is expressed as a ratio, the rate of return for horticulture farms can be compared with the rate of return for other farm types or other potential investment. For example, the average rate of return for broadacre farms in 2014–15 was 1.4 per cent (Martin 2016).
The average rates of return to capital (excluding capital appreciation) for citrus growers were mostly positive from 2006–07 to 2015–16 and averaged around 1.0 per cent over the period (Figure 8). Average rates of return for pome/stone fruit growers were less favourable, with three years of negative returns and an average of 0.6 per cent over the survey period. Both citrus growers and pome/stone fruit growers recorded their lowest average rate of return in 2011–12 because of low commodity prices in that year.
average per farm
Source: ABARES Murray–Darling Basin Irrigation Survey
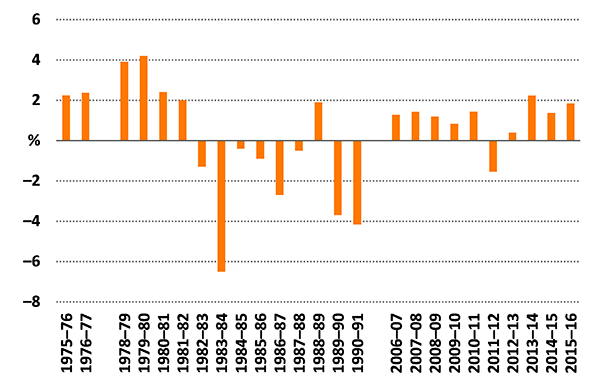
Figure 9 shows a long-term series of rate of return for citrus farms in the southern Basin. Estimates for available years between 1975–76 and 1990–91 were sourced from previous surveys of citrus farms in the Murrumbidgee and Murray regions.
Citrus farms recorded negative rates of return (excluding capital appreciation) in 8 of the 15 years for which data are available between 1975–76 and 1990–91. The average rate of return for the 15 years was –0.1 per cent although rates of return varied considerably over the period, with a low of –6.5 per cent in 1983–84 and a high of more than 4 per cent in 1979–80.
average per farm
Sources: ABARE 1990 to 1992; BAE 1980 to 1989; ABARES Murray–Darling Basin Irrigation Survey
Farm investment
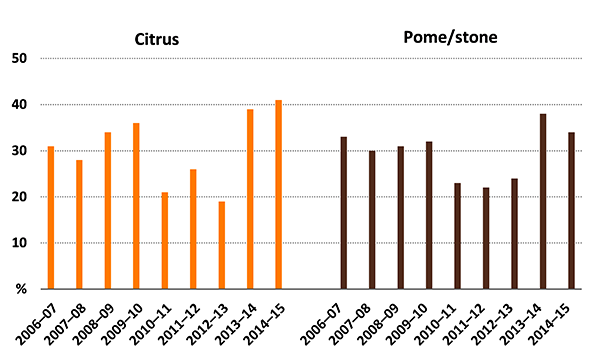
Around 30 per cent of citrus growers each year, on average, made new capital additions over the period 2006–07 to 2014–15, ranging from a low of 19 per cent in 2012–13 to a high of 41 per cent in 2014–15 (Figure 10).
In 2014–15 average total capital additions was around $89,100 per farm for those citrus growers making additions. Additions to plant and equipment (including irrigation infrastructure) accounted for around 48 per cent of capital additions in 2014–15, land accounted for 41 per cent and buildings and structures accounted for the remaining 11 per cent.
On average, around 30 per cent of pome/stone fruit growers each year made capital additions over the period 2006–07 to 2014–15, ranging from a low of 22 per cent in 2011–12 to a high of 38 per cent in 2013–14 (Figure 10).
In 2014–15 average total capital additions was around $89,400 per farm for those pome/stone fruit growers making additions. Additions to plant and equipment (including irrigation infrastructure) accounted for around 53 per cent of capital additions in 2014–15, land accounted for 37 per cent and buildings and structures accounted for the remaining 10 per cent.
average per farm
Water use and irrigation technology
Horticulture growers in the Murray–Darling Basin use irrigation water to supplement rainfall to produce a range of crops. In many areas of the Basin these crops could not be grown without irrigation because of the warm and relatively dry climate.
Rainfall and irrigation water allocations were extremely low from 2006–07 to 2009–10 as a result of severe drought and reduced water in storages. As the drought worsened and allocations reached record lows in 2007–08, many horticulture growers purchased temporary water to keep their fruit trees productive or merely alive.
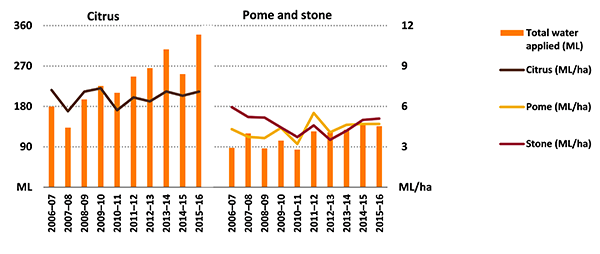
Perennial tree crops require a minimum volume of water to sustain life and substantially more water to achieve fruit of a quality and quantity required for commercial purposes. The average water application rate for citrus trees was 5.6 megalitres a hectare over the period 2006–07 to 2015–16 (Figure 11). Average water application rates for both pome fruit and stone fruit trees were 4.3 megalitres and 4.6 megalitres a hectare, respectively, from 2006–07 to 2015–16.
Citrus trees had higher water application rates than pome fruit and stone fruit trees because they have:
- a relatively hotter and drier growing environment
- higher crop water requirements
- requirements for flushing salt from soil linked to growing location.
Citrus-growing farms in the survey regions were also much larger on average than pome/stone fruit growing farms. As a consequence, citrus growers used more water per farm, on average, than pome/stone fruit growers (Figure 11).
average per farm
Source: ABARES Murray–Darling Basin Irrigation Survey
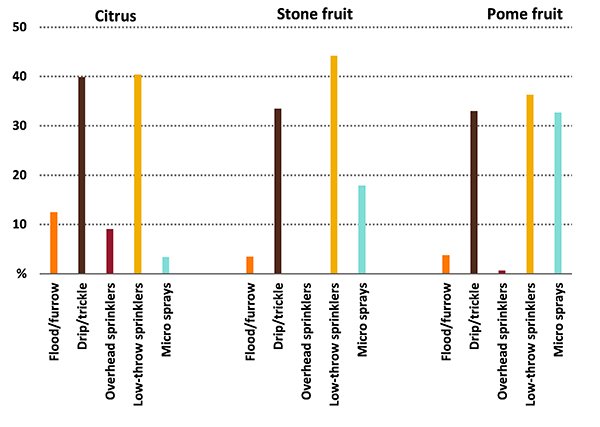
Figure 12 shows the average proportion of citrus and pome/stone fruit farms using various irrigation systems over the survey period. Drip/trickle and low-throw sprinkler systems were the most common irrigation methods. At least one-third of farms in each of the three groups used these two systems over the survey period. One-third of pome fruit growers also used micro spray systems.
Source: ABARES Murray–Darling Basin Irrigation Survey
Water trading
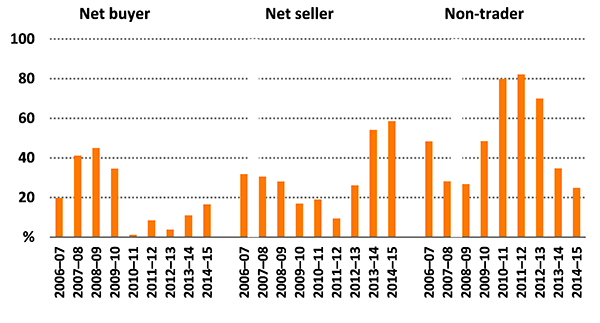
The proportion of citrus growers trading water allocations varied from year to year over the survey period. Citrus growers’ participation in water markets tended to be higher in drier years—particularly in 2007–08 and 2008–09, when about 40 per cent of citrus farms were net buyers and around 30 per cent were net sellers (Figure 13).
Source: ABARES Murray–Darling Basin Irrigation Survey
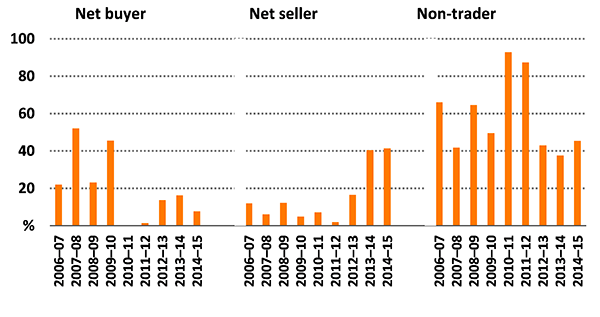
On average, from 2006–07 to 2014–15, around 60 per cent of pome/stone fruit growers did not trade allocation water (Figure 14). The highest proportions of net buyers of allocation water occurred during the drought years from 2006–07 to 2009–10. In most years, less than 12 per cent of pome/stone fruit growers were net sellers of water allocations.
Source: ABARES Murray–Darling Basin Irrigation Survey
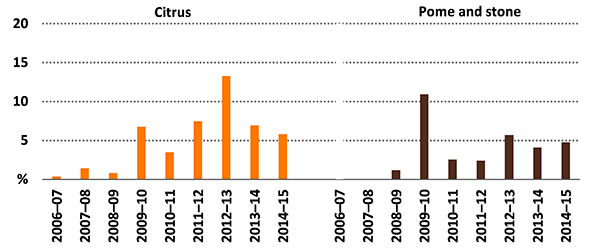
In addition to the allocation water market, the market for permanent water access entitlements also provides irrigators with a tool for managing their farm businesses. Although relatively few citrus growers sold entitlements from 2006–07 to 2010–11, the proportion of sellers increased significantly in 2011–12 and 2012–13 (Figure 15). Apart from 2009–10, the proportion of pome/stone fruit farms selling entitlements was generally lower than for citrus growers.
References
ABS 2008, Agricultural commodities, Australia, 2005–06, cat. no. 7121.0, Australian Bureau of Statistics, Canberra, March.
ABS 2012, Agricultural commodities, Australia, 2010–11, cat. no. 7121.0, Australian Bureau of Statistics, Canberra, June.
APAL 2015, Statistics: Australian apple and pear industry, Australian Apple and Pear Ltd, Melbourne.
Citrus Australia Ltd 2013. A review of the citrus industry in Australia, submission to the Senate Standing Committees on Rural and Regional Affairs and Transport review of the citrus industry in Australia, Mildura, April.
Martin, P 2016, ‘Farm performance: broadacre and dairy farms, 2013–14 to 2015–16’, in Agricultural commodities: March quarter 2016, Australian Bureau of Agricultural and Resource Economics and Sciences, Canberra, March.
Data and other resources
Previous reports
Horticulture farms in the Murray-Darling Basin, 2012-13 to 2014-15
