Authors: Dale Ashton and Jay Gomboso
The southern Murray–Darling Basin has around one-fifth of Australia’s total dairy farms. In 2014–15 irrigated dairy production contributed 17 per cent of the total gross value of irrigated agricultural production in the Basin (ABS 2016).
Dairy farming in the Murray–Darling Basin is concentrated in the southern Basin areas of northern Victoria and to a lesser extent southern New South Wales (Map 1). Smaller numbers of farms are located near Forbes and Wagga Wagga in New South Wales, Toowoomba and Warwick in Queensland and around Murray Bridge in South Australia.

[expand all]
Dairy production in the Murray–Darling Basin
Since the early 1980s the number of dairy farms in Australia has fallen by nearly two-thirds, the total area used for dairying has halved and the milk product processing and distribution sectors have been significantly rationalised. Despite these industry adjustments, total Australian milk production rose from 5.4 billion litres in 1979–80 to a peak of 11.2 billion litres in 2001–02, before declining to around 9.4 billion litres in 2013–14 (ABARES 2017). Total milk production subsequently increased to an estimated 9.7 billion litres in 2014–15.
This restructuring has promoted a more efficient industry and has enabled growth in the gross value of Australian dairy production per farm in real terms (Ashton et al. 2014). Dairy farmers have adapted to the changing business environment by increasing the size and intensity of their operations—by having more cows per farm and higher stocking rates, and making greater use of supplementary feeding. Farmers have also adopted new technologies, which have resulted in dairy farms becoming more capital intensive and less reliant on labour.
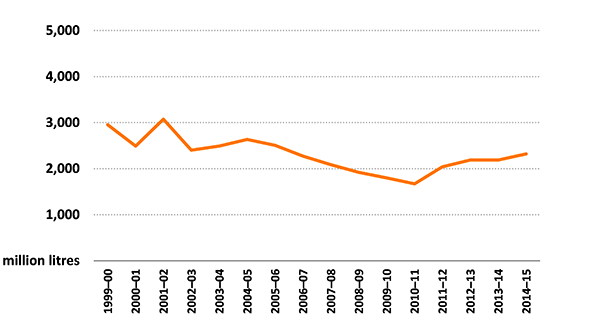
Total milk production in the southern Murray–Darling Basin mostly declined between the early 2000s and 2010–11 (Figure 1). Increases in milk production after 2010–11 were the result of improved seasonal conditions and water availability, combined with higher farmgate milk prices in 2011–12 and 2013–14.
In this report, the population of dairy farms in the southern Murray–Darling Basin has been divided into three groups according to cow herd size:
- farms milking fewer than 200 cows
- farms milking between 200 and 350 cows
- farms milking more than 350 cows.
In 2014–15 around one-third of farms fell into each group.
In the southern Basin most of the decline in registered dairy farm numbers occurred in the group milking fewer than 200 head (Figure 2). The decline in the number of small farms occurred because some farmers exited the industry and some expanded the scale of their operations and moved into the larger categories shown in Figure 2. At the same time, the average farm area operated by the group with fewer than 200 cows increased by more than 50 per cent.
In the group milking between 200 and 350 cows, average farm area and farm numbers showed no consistent trends over the survey period. In 2014–15 registered farm numbers and average farm area were both slightly higher than in 2006–07.
average per farm and farm numbers
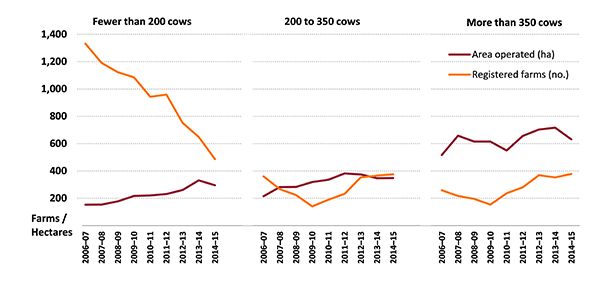
For the group milking more than 350 cows, the trend in farm numbers and area operated was similar to the group with 200 to 350 cows. However, the group with more than 350 cows operated significantly larger farms than the other two groups.
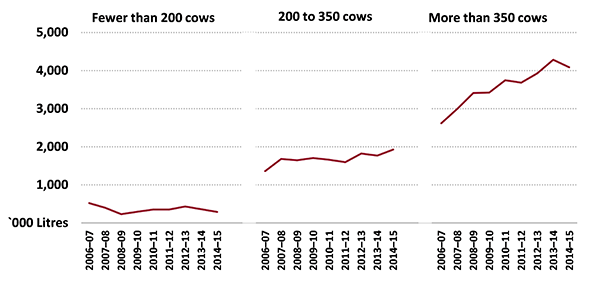
Figure 3 shows average milk production for the three herd size groups from 2006–07 to 2014–15. Average farm area increased in the group milking fewer than 200 head, but average milk production per farm declined because some of these farms diversified away from specialist milk production.In contrast to the group with fewer than 200 cows, average milk production in the group with more than 350 cows increased proportionally more than farm area. This resulted in generally higher milk production per hectare.
average per farm
Note: Survey estimates for milk production are not available for 2015–16.
Source: ABARES Murray–Darling Basin Irrigation Survey
Crop and livestock enterprise mix
One way dairy farmers manage changes in their farm operating environment is by adjusting the mix (or diversity) of agricultural enterprises each year. Most dairy farms produce more than one agricultural commodity, including crop and livestock outputs, even though milk accounts for the majority of total cash receipts on average. However, the options for dairy farmers tend to be more limited in the short term than for other irrigated farms such as rice or cotton.
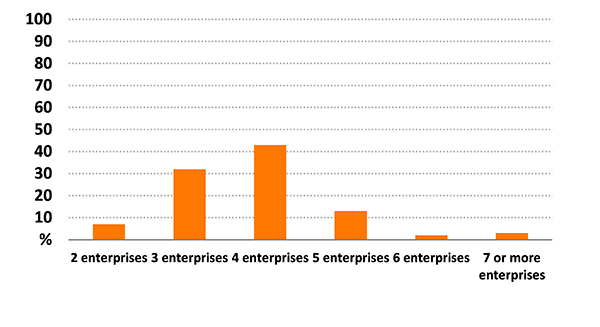
Receipts from crop sales are relatively small for dairy farmers, but the mix of crops and pasture grown is important for total water use on irrigated dairy farms. Over the period 2006–07 to 2014–15 an estimated 61 per cent of dairy farms irrigated 4 or more individual enterprises each year, including pasture, hay and various other crops. The remaining 39 per cent of farms irrigated 2 or 3 enterprises each year (Figure 4).
Per cent of farms
Dairy farmers' intentions
As part of the ABARES survey of irrigation farms in the Murray–Darling Basin, irrigators were asked to describe what they expected to be doing in 3 years. These results indicate future intentions and can also be interpreted as an indicator of sentiment or industry confidence at the time of the survey.
At the time of the survey in early 2016, an estimated 63 per cent of dairy farmers indicated that their farming operations would not change in the next 3 years. This proportion has fluctuated over the period of the survey, from a low of 42 per cent in 2006–07 to a high of 81 per cent in 2013–14.
Around 32 per cent of dairy farmers surveyed in 2016 indicated an intention to retire or sell their farm over the next 3 years. This proportion was higher than in 2012–13 and 2013–14 (around 10 per cent each year) but lower than in 2011–12 when 40 per cent of dairy farmers indicated an intention to retire or sell the farm.
Over the period 2006–07 to 2014–15 dairy farmers that were intending to retire or sell their farm operated smaller farms than the average. Those intending no change to their farming operations operated farms larger than the average (Table 1). Those intending to retire or sell their farm had lower than average farm financial performance but less debt and a higher average equity ratio.
Note: Average per farm over the period 2006–07 to 2014–15. The results for ‘all other farms’ includes farms not included in the other two groups shown in the table.
Source: ABARES Murray–Darling Basin Irrigation Survey
Farm performance and investment
Farm performance
Farm financial performance is a key driver of change in the dairy industry. Two measures of farm financial performance used in this report are farm cash income and rate of return.
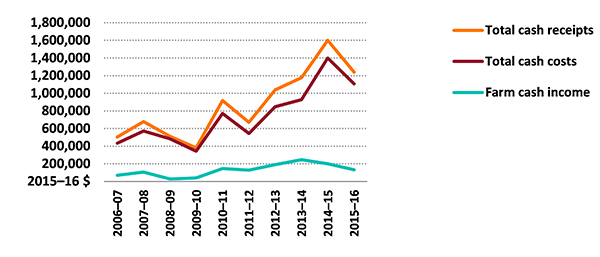
Farm cash income is defined as total cash receipts minus total cash costs. It is a short term measure of the cash surplus available to a farm business to reinvest or draw family income after costs have been taken into account.
Total cash receipts are the cash revenues received by a farm business. In most cases, the largest receipt item is milk sales. Other (usually minor) items include allocation water sales, contracting and government assistance payments.
Total cash costs are payments made for materials and services and include administration costs, crop-related expenses, interest and permanent and casual labour. Capital and household expenditures are not included in total cash costs.
Incomes of dairy farmers in the Murray–Darling Basin fluctuated widely over the survey period from 2006–07 to 2015–16 (Figure 5). This was a result of fluctuations in farmgate milk prices (largely because of changes in world dairy product prices) and variations in milk production and total costs (particularly fodder), which were heavily influenced by prevailing seasonal conditions.
average per farm
Source: ABARES Murray–Darling Basin Irrigation Survey
Components of receipts
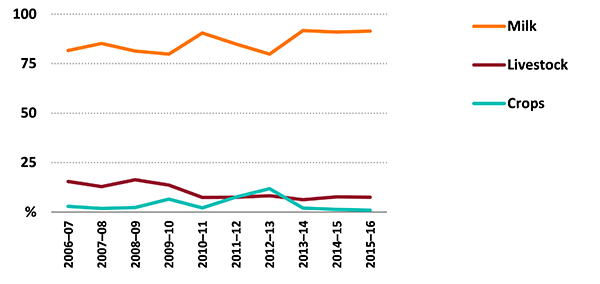
Receipts from milk accounted for around 85 per cent of total cash receipts for dairy farms over the period 2006–07 to 2015–16 (Figure 6). Sales of dairy and beef cattle accounted for a further 10 per cent of total cash receipts and the remaining 5 per cent mostly comprised a mix of receipts from crops, off-farm contracting and other receipts. For those farms selling water allocations, receipts from water sales accounted for an average of 7 per cent of total cash receipts over the survey period.
average per farm
Source: ABARES Murray–Darling Basin Irrigation Survey
Components of costs
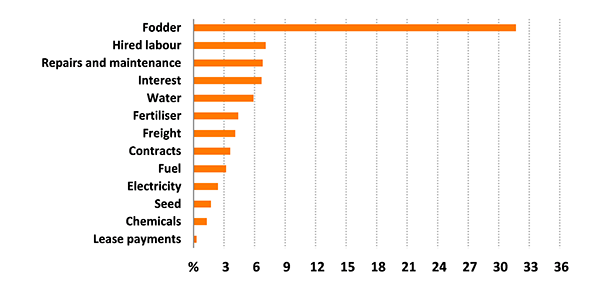
Fodder was the major cost item for dairy farms, accounting for an estimated 32 per cent of total cash costs on average over the period 2006–07 to 2015–16 (Figure 7). Although fodder costs fluctuated considerably over the period—because of the need to purchase additional fodder during drier times as well as variation in fodder prices—it was still the main cost item in all years, ranging from a low of 23 per cent of total cash costs in 2011–12 to a high of 40 per cent in 2007–08 and 2008–09. In 2015–16 fodder is estimated to have accounted for 34 per cent of total cash costs.
Instead of purchasing fodder, dairy farmers can grow their own feed on farm using either pasture or fodder crops. Access to irrigation water is important for dairy farmers to produce their own fodder. On average over the survey period water costs (including bulk water charges and purchases of water allocations) accounted for an estimated 6 per cent of total cash costs, ranging from a high of 9 per cent in 2013–14 to a low of 4 per cent in 2007–08, 2010–11 and 2015–16.
Water costs (including temporary water purchases, fixed charges and other water costs) as a proportion of total cash costs fell in 2007–08 and 2010–11 because relatively few dairy farmers bought water allocations, largely because of high prices. For farmers buying allocations, water costs accounted for 9 per cent of total cash costs in 2007–08 and 2010–11 compared with 2 per cent of total cash costs for non-traders. In 2013–14 water costs increased as a proportion of total cash costs because of increases in the proportion of dairy farmers purchasing water allocations and traded water prices.
average per farm
Rate of return
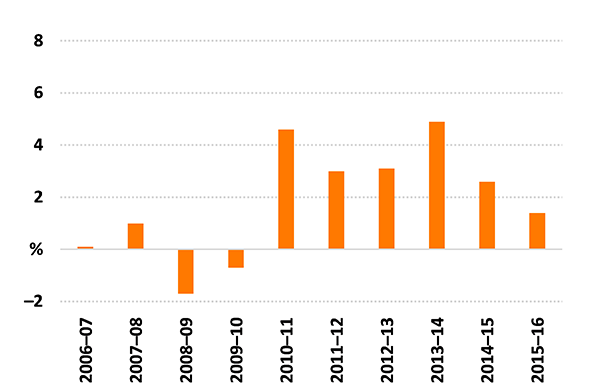
Figure 8 shows the average annual rate of return to capital (excluding capital appreciation) for dairy farms in the southern Murray–Darling Basin. Rate of return is a measure of the annual profit generated by a business, expressed as a percentage of the value of the capital used to generate that profit. Because it is expressed as a ratio, the rate of return for dairy farms can be compared with the rate of return for other farm types or other potential investments. For example, the average rate of return for broadacre farms in 2014–15 was 1.4 per cent (Martin 2016).
The estimated average rate of return (excluding capital appreciation) for dairy farms was 2.6 per cent in 2014–15 and 1.4 per cent in 2015–16, compared with an average of 4.9 per cent in 2013–14 (Figure 8). The average rate of return for dairy farms over the entire period of the survey—from 2006–07 to 2015–16—was 1.8 per cent.
As a result of farm financial performance declining between 2013–14 and 2015–16, the proportion of dairy farms with a positive rate of return fell from 72 per cent in 2013–14 to an estimated 49 per cent in 2015–16. In comparison, the proportion of dairy farms with total cash receipts greater than total cash costs—fell from 79 per cent in 2013–14 to an estimated 65 per cent in 2015–16.
average per farm
Source: ABARES Murray–Darling Basin Irrigation Survey
Farm investment
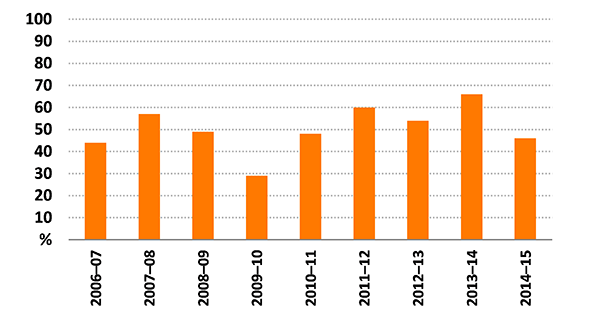
Around 50 per cent of dairy farmers each year, on average, made new capital investments over the period 2006–07 to 2014–15, ranging from a low of 29 per cent in 2009–10 to a high of 66 per cent in 2012–13 (Figure 9).
In 2014–15 average total capital additions was around $183,000 per farm for those dairy farmers making additions. Additions to plant and equipment (including irrigation infrastructure) accounted for around 32 per cent of capital additions in 2014–15, land accounted for 34 per cent and buildings and structures accounted for the remaining 32 per cent.
average per farm
Water use and irrigation technology
Dairy farms in the Murray–Darling Basin use irrigation water to supplement rainfall to produce pasture and fodder crops. Irrigation allows farmers to have a more stable and productive supply of pasture than possible when relying on highly variable seasonal rainfall. The volume of water used in an irrigation season depends on temporary water allocations, the price of water on the temporary market, the price of fodder and feed grains, and climate (that is, evapotranspiration and rainfall).
Dairy feeding regimes can range from being entirely based on pasture and forage crops to being based predominantly on grains and concentrates. Dairy farmers’ demand for irrigation water is consequently derived from their need to grow dairy feed on-farm and the mix of pasture and grain in feed rations.
Results vary widely across farms, but the survey data reveal a small positive relationship between the volume of irrigation water used and milk yield per cow. This reflects the importance of water (irrigation and rainfall) to pasture and crop production and, consequently, milk production. For individual farms this relationship is heavily affected by prevailing seasonal conditions and the extent to which purchased feed is substituted for feed grown on-farm.
Water allocations and rainfall were extremely low from 2006–07 to 2009–10 as a result of severe drought and reduced water in storages. In response to worsening drought and consequent reduced pasture production, some dairy farmers increased the amount of concentrated rations (including grain, supplements and hay) they fed to maintain milk production. At the same time, feed grain prices rose as the effect of drought on winter and summer grain production became more apparent. Some farmers chose to reduce cow numbers rather than pay higher grain and fodder costs.
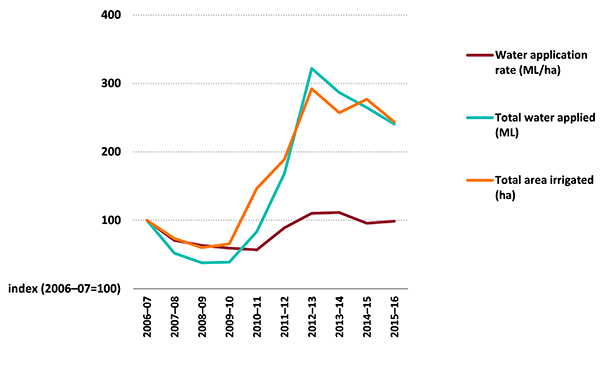
The average total volume of water applied to crops and pasture increased significantly as water availability and seasonal conditions improved from 2010–11 onward (Figure 10). This increase in total water used was more as a result of increases in average area irrigated, rather than increases in water application rates per hectare.
Individual farm data show that some farms had large fluctuations in areas of crops and pasture irrigated from year to year. Even when water was scarce and prices rose, some farms consistently irrigated relatively small areas each year to maintain their core breeding herd.
The volume of water used and water application rates per hectare on individual farms can fluctuate widely from year to year in response to changes in allocations, traded water prices and seasonal conditions. However, analysing long-term trends in water use efficiency and irrigation infrastructure is difficult because the data do not include the period before the severe drought of the mid 2000s.
Source: Murray–Darling Basin Irrigation Survey
The seasonal pattern of milk production on dairy farms has important implications for input use. Dairy farmers typically choose calving patterns to maximise their profitability—largely influenced by seasonal price incentives and feed supply factors. These calving patterns then determine seasonal demand for feed, water and other inputs.
From 2006–07 to 2015–16 around 65 per cent of dairy farms in the Murray and Goulburn–Broken regions used a year-round calving pattern, 26 per cent used split calving and 9 per cent used seasonal calving. In year-round calving, herds calve for at least 10 months of the year, in split calving herds calve at two or three distinct times of the year (for example, in spring and autumn) and in seasonal calving all cows calve at a single time each year (Dairy Australia 2015).
The relationship between water use and milk yield was strongest for those with year-round calving. This reflects the need to use irrigation water to produce pasture and fodder crops to maintain milk production during summer and winter when less pasture is available.
Dairy farms can respond to a long-term reduction in water availability by changing their milking pattern from year-round to seasonal or split milking. However, milk supply contracts often lock farmers into higher-cost, year-round supply.
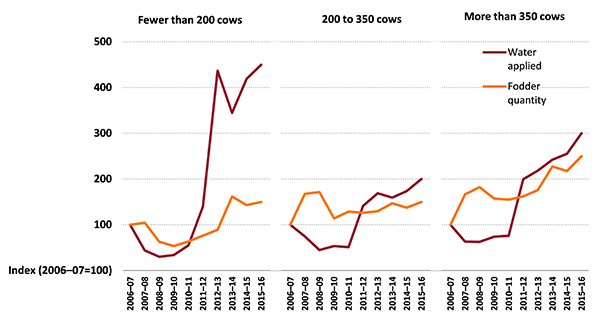
The mix of pasture and grains in a feeding regime depends on the cost of producing pasture and fodder crops relative to the price of hay or grains. Consequently, when water prices rise, the marginal cost of producing pasture and fodder crops increases and dairy farms may substitute other inputs (such as purchased hay or grain) for irrigated pasture and crops or change the feeding regime. Figure 11 shows indexes—proportional yearly changes from a base year—for average total water applied and estimated quantities of fodder purchased, by herd size. Water use declined and fodder purchases increased during the drought years from 2006–07 to 2009–10 for the groups of 200 to 350 cows and more than 350 cows. Many smaller farms reduced the number of cows milked over this period because weaker financial performance meant they did not have the same capacity as larger farms to purchase fodder or water.
average per farm
Sources: ABARES 2015; ABARES estimate; Murray–Darling Basin Irrigation Survey
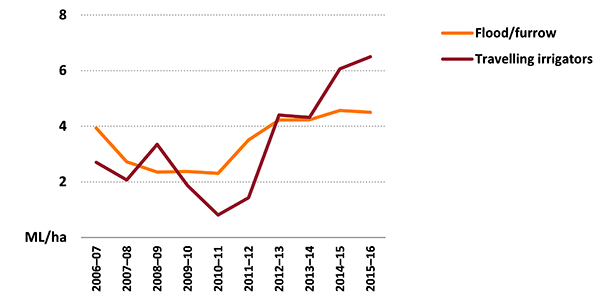
Over the survey period most dairy farms changed the way they managed water—such as through timing irrigation and use of soil moisture monitoring—rather than technologies used to apply water. Flood/furrow systems were the most commonly used technologies for applying water to pasture on dairy farms (Figure 12). Smaller proportions of farms used travelling irrigators. Other investments included laser levelling, metering and piping irrigation canals.

Source: Murray–Darling Basin Irrigation Survey
Water use and application rates declined from 2006–07 to 2008–09 because irrigators modified their irrigation practices to accommodate reduced water allocations. Wet seasonal conditions in 2010–11 led to lower average water application rates, particularly for those using travelling irrigators. Greater water availability in subsequent years resulted in increased water use on dairy farms and higher application rates per hectare due to many farmers returning to using pre-drought irrigation management practices (Figure 13).
average per farm
Source: Murray–Darling Basin Irrigation Survey
Water trading
Water trading has provided dairy farmers with greater flexibility to manage their water use. For example, survey results show that some dairy farms reduced water use for dairy production during drought in the mid 2000s and instead generated income from selling water allocations or entitlements.
In 2006–07—the first year drought severely affected irrigation allocations for dairy farmers—many dairy farmers initially purchased water on the temporary market and continued to irrigate pasture and crops. As the price of temporary water rose, it became more cost effective for dairy farmers to sell water allocations and purchase fodder and feed grains than produce fodder on farm. The survey results show that the ability to trade water allocations was also important in seasons with higher water availability.
The proportion of dairy farmers trading water allocations varied from year to year between 2006–07 and 2014–15 but the majority of farmers in any given year did not trade water allocations until 2012–13 and 2013–14 (Figure 14). The proportion of dairy farmers that were net buyers of water allocations increased in 2012–13 and 2013–14. Some dairy farmers indicated this was because of changes in business strategy to source water from temporary markets rather than holding permanent entitlements. In 2014–15 the proportion of dairy farmers that were net buyers of water fell to around 40 per cent, partly in response to higher water prices.
proportion of farms
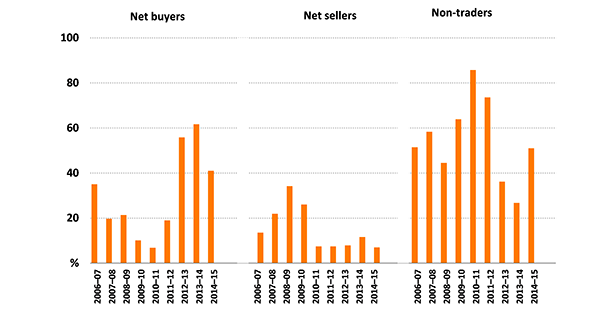
Note: Net buyers are farms that bought more water than they sold. Net sellers were farms that sold more water than they bought.
Source: Murray–Darling Basin Irrigation Survey
Some dairy farmers now hold no or few permanent water entitlements and completely rely on the temporary water market. These farmers are purchasing water as part of routine farm business activities using one or more trading strategies, including:
- buying water when it is needed, subject to farm cash flow and water prices
- buying water early in the season and holding for future use to hedge against seasonal conditions and/or higher water prices
- buying water in small parcels throughout the season when the price is low enough
- buying fodder when the cost of purchasing water and producing fodder on-farm rises above the cost of purchasing fodder
- carrying over water allocations from the previous season to hedge against rising water prices or to sell if not required
- leasing temporary water from other irrigators.
In addition to the temporary allocation water market, the market for permanent water access entitlements also provides irrigators with a tool for managing their farm businesses. The ABARES irrigation survey results show that some dairy farmers sold part or all of their entitlements to the government. At least part of the proceeds from entitlement sales were used to reduce farm debt. Some irrigators sold entitlements and ceased irrigating or farming altogether but others continued irrigated farming by purchasing seasonal water allocations or entitlements.
References
ABARES 2017, Agricultural commodities: March quarter 2017, Australian Bureau of Agricultural and Resource Economics and Sciences, Canberra.
ABS 2016, Gross value of irrigated agricultural production, 2014–15, cat. no. 4610.0, Australian Bureau of Statistics, Canberra, September.
Ashton, D, Cuevas-Cubria, C, Leith, R & Jackson, T 2014, Productivity in the Australian dairy industry: pursuing new sources of growth, ABARES research report 14.11, Australian Bureau of Agricultural and Resource Economics and Sciences, Canberra, September.
Dairy Australia 2015, Fertility, Animal management, Dairy Australia, Southbank.
Martin, P 2016, ‘Farm performance: broadacre and dairy farms, 2013–14 to 2015–16’, in Agricultural commodities: March quarter 2016, Australian Bureau of Agricultural and Resource Economics and Sciences, Canberra, March.
Data and other resources
| Document | Pages | File size |
|---|---|---|
Dairy farms in the Murray-Darling Basin – Figures 2017 XLSX  |
232 KB |
If you have difficulty accessing this file, visit web accessibility for assistance.
