Author: Dale Ashton
The Murray–Darling Basin accounts for around 91 per cent of Australia’s total cotton farms and cotton area (ABS 2016a). From 2006–07 to 2014–15 irrigated cotton contributed an average of around 18 per cent of the total gross value of irrigated agricultural production in the Basin (ABS 2016b).
Cotton is mostly grown in northern areas of the Murray–Darling Basin, particularly the Condamine–Balonne, Border Rivers and Namoi regions (Map 1). Cotton is also grown in the Macquarie–Castlereagh, Lachlan, and Murrumbidgee regions in the central and southern Basin.

[expand all]
Cotton production in the Murray–Darling Basin
Cotton is generally higher value and more profitable than alternative crops such as grain sorghum, wheat and oilseeds. As a consequence, cotton producers tend to base their cotton planting decisions on the volume of water they have available (water budgeting) and are less responsive to changes in cotton prices. Cotton growers’ widespread use of futures markets and hedging also reduces the responsiveness of cotton plantings to changes in spot prices. However, when prices fall sharply, as occurred in 2011–12, the profitability of cotton relative to other crops becomes increasingly important to crop selection decisions.
Total cotton production (irrigated and dryland) in Australia has fluctuated widely in response to changing seasonal and market conditions (Figure 1). During the drought-affected period from 2006–07 to 2009–10 cotton production fell to a low last recorded in the early 1980s. With improved seasonal conditions in 2010–11 and 2011–12 and higher world cotton prices relative to prices for other commodities, production increased to more than 1,200 kilotonnes in 2011–12. A return to drier seasonal conditions, reduced water availability and falling cotton prices resulted in declines in cotton production from 2012–13 to 2014–15. In 2015–16 Australian cotton production is estimated to have risen by around 19 per cent.

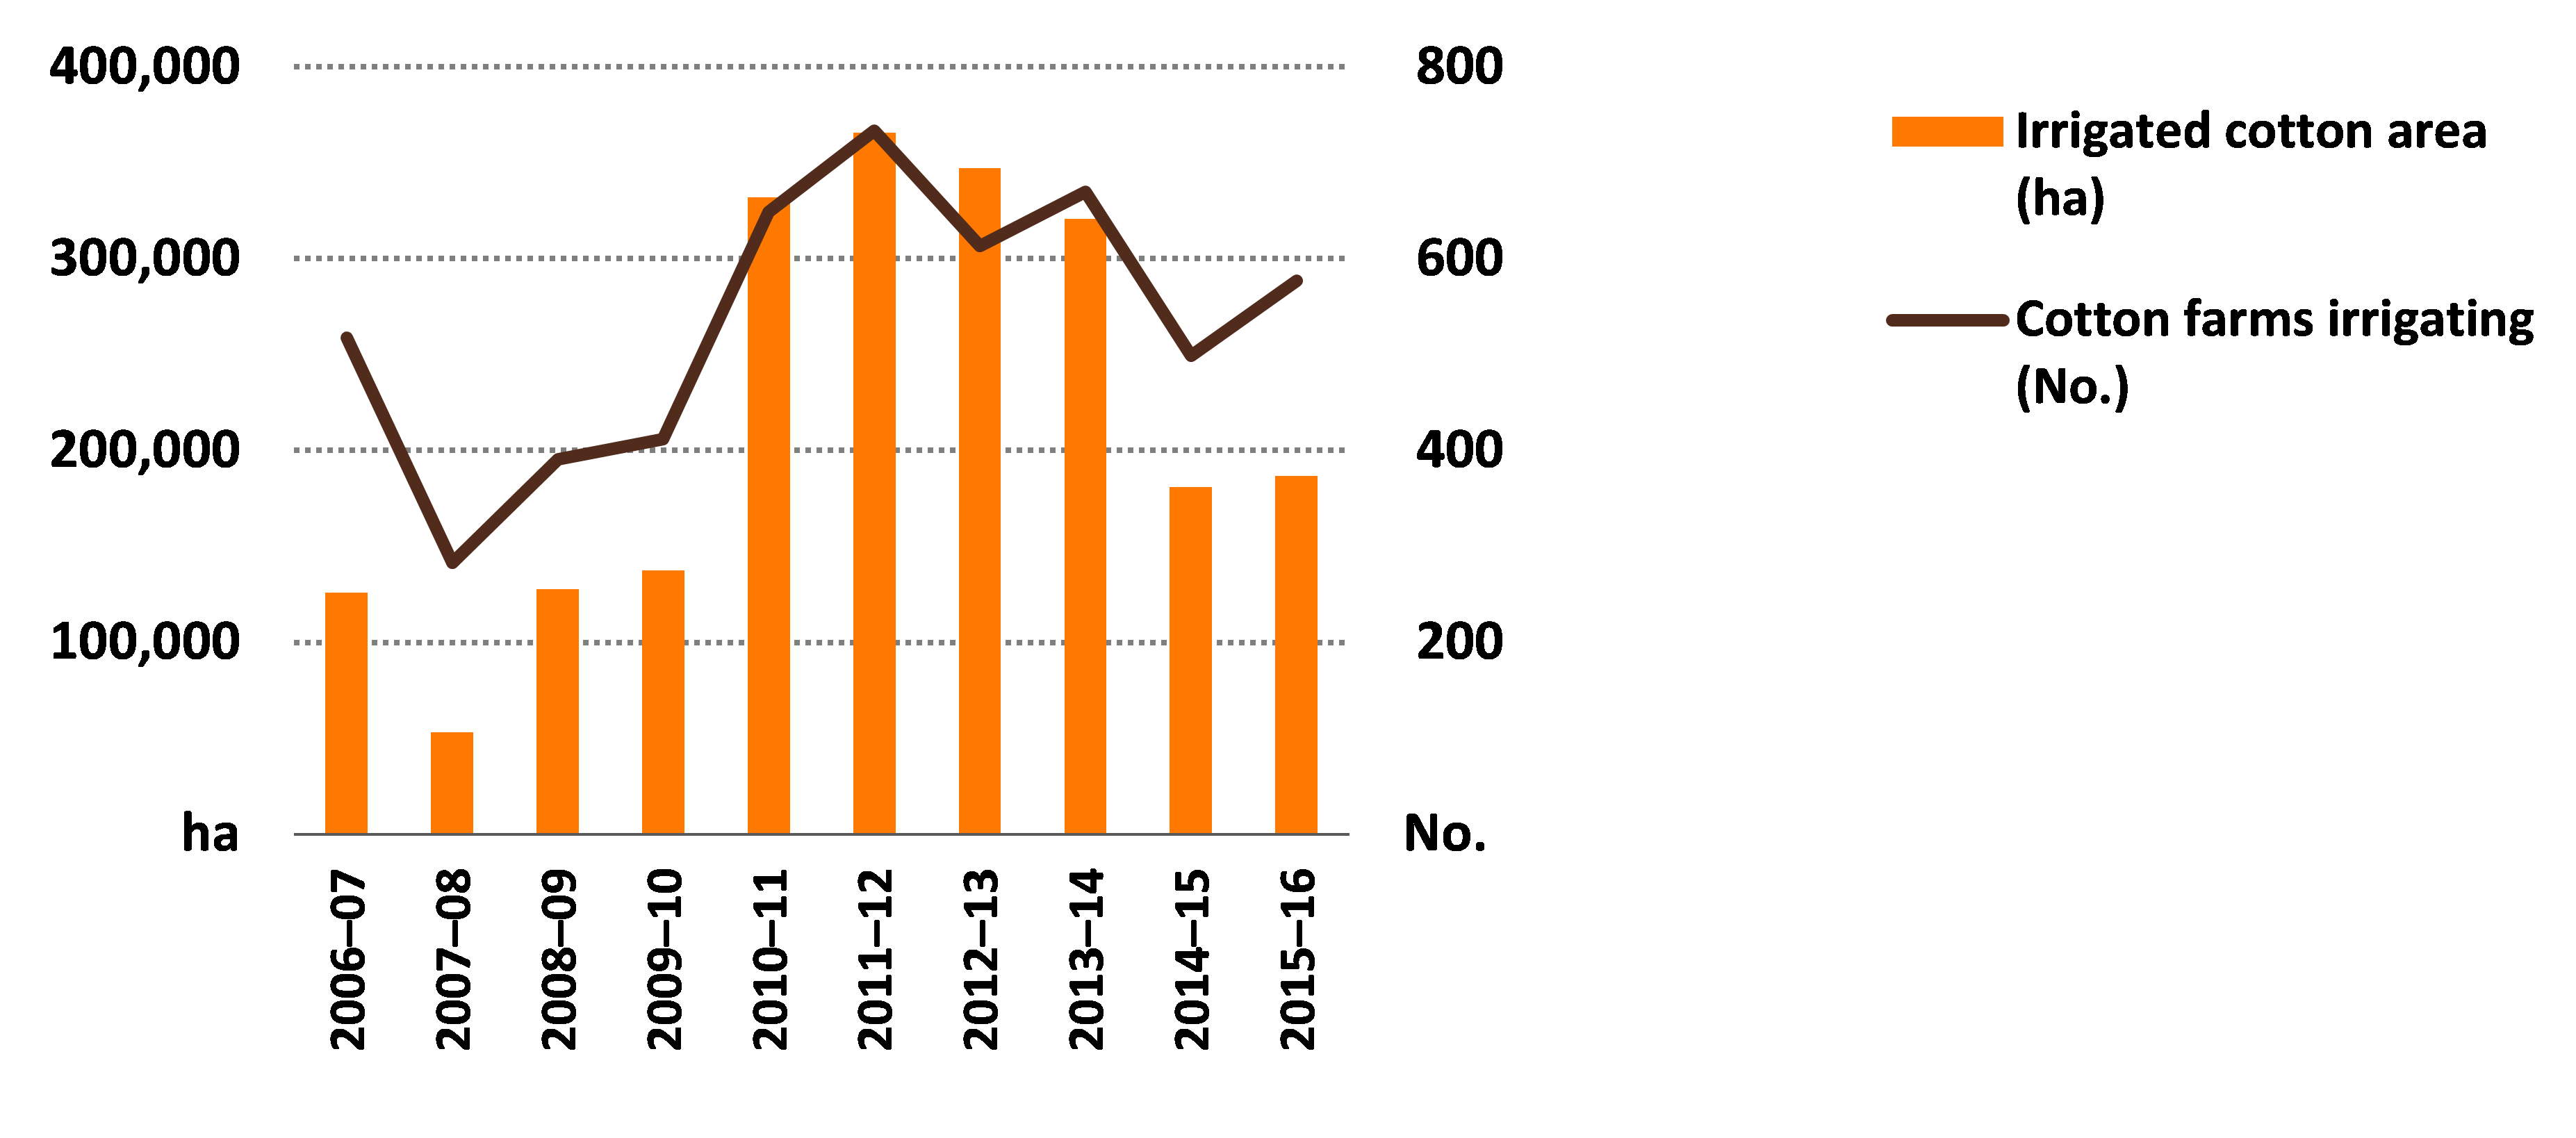
The number of farms growing irrigated cotton fluctuates from year to year, largely depending on the availability of water (from either irrigation or rainfall) and, to a lesser extent, the profitability of growing cotton relative to other crops. The number of farms growing irrigated cotton followed a similar trend to irrigated cotton area over the period 2006–07 to 2014–15 (Figure 2).
Crop and livestock enterprise mix
One way cotton farmers manage changes in their farm operating environment is by adjusting the mix (or diversity) of agricultural enterprises each year. Such changes are most common on farms that grow annual crops such as cotton. The relatively large cropping areas of these farms gives cotton farmers scope to grow a mix of crops depending on market and seasonal conditions (including water availability).
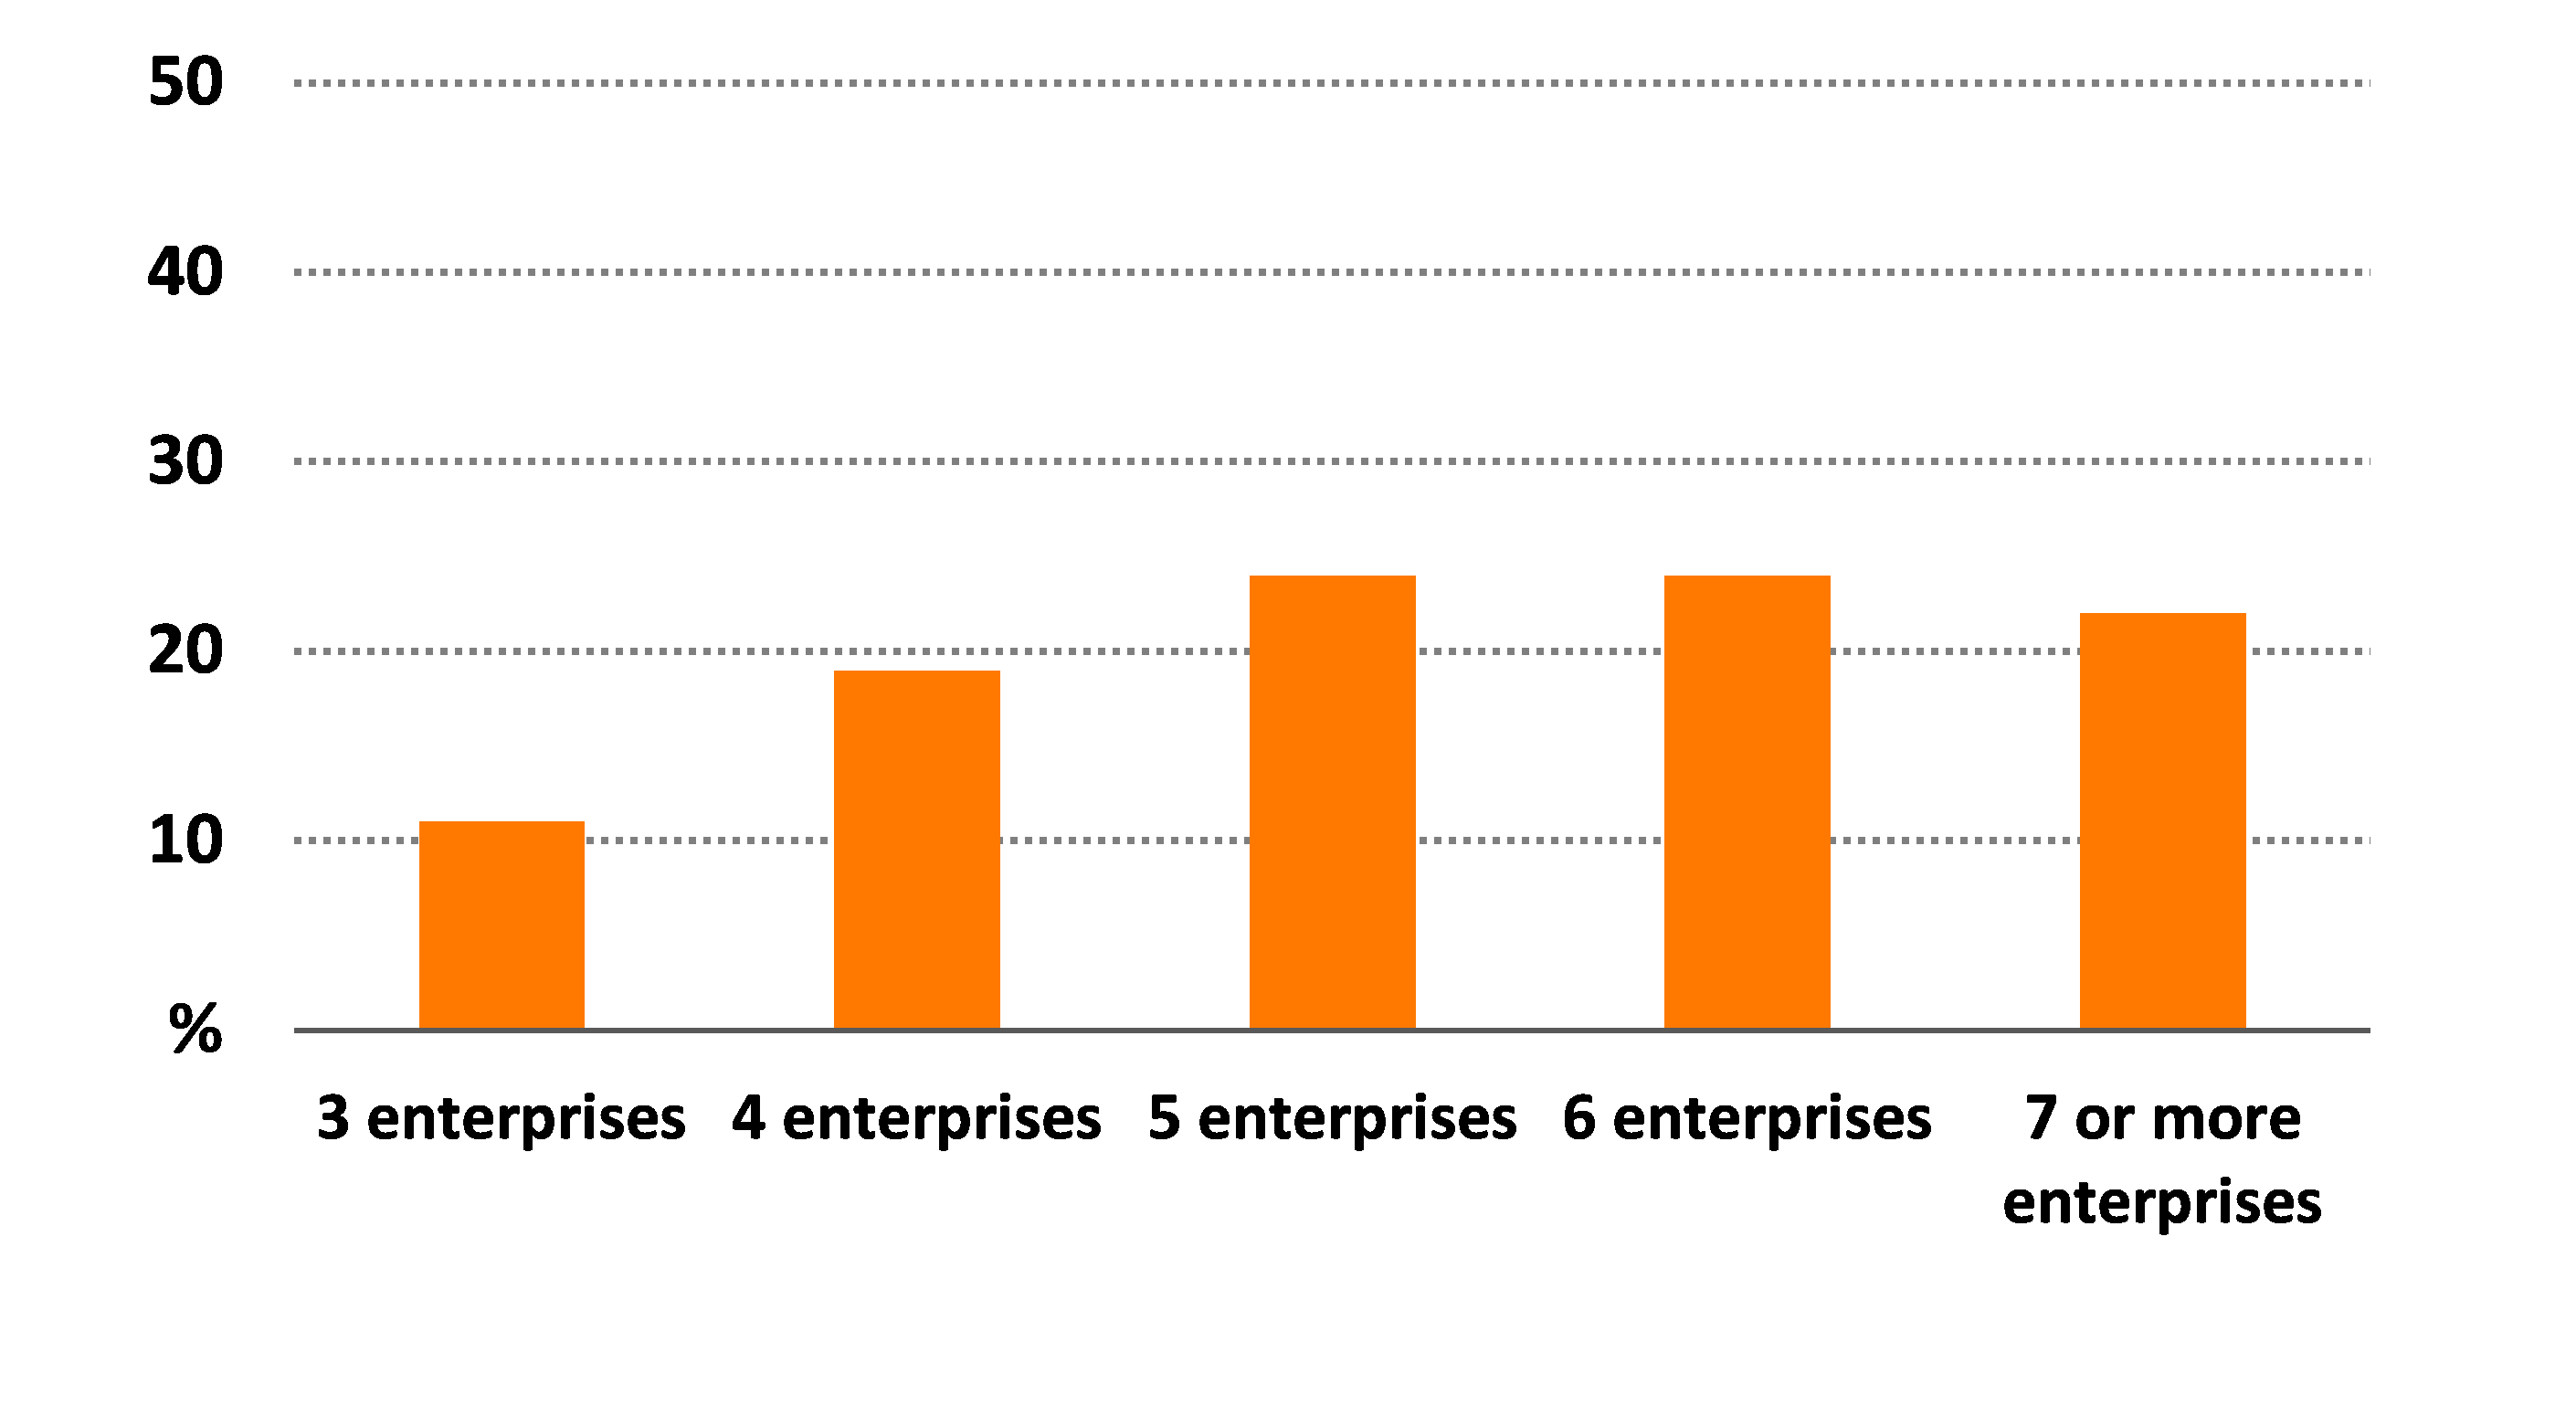
Most cotton farms produce more than one agricultural commodity, including crop and livestock outputs. Over the period 2006–07 to 2015–16 an estimated 22 per cent of cotton farms had 7 or more individual crop/livestock enterprises each year and 78 per cent of farms had between 3 and 6 enterprises each year (Figure 3). Cotton growers had the most diversified mix of commodities of all irrigated industries in the Murray–Darling Basin, including irrigated and dryland cotton, wheat, grain sorghum, barley, oilseeds, grain legumes and livestock. In comparison, grape growers had the least diversified farms with around 86 per cent of grape growers having 3 different crops.
percent of farms
Cotton growers’ intentions
As part of the ABARES survey of irrigation farms in the Murray–Darling Basin irrigators were asked to describe what they expected to be doing in three years. These results indicate future intentions and can also be interpreted as an indicator of sentiment or industry confidence at the time of the survey.
At the time of the survey in early 2016, an estimated 65 per cent of cotton growers indicated that their farming operations would not change in the next 3 years. This proportion increased over the period of the survey from 2006–07 when only 47 per cent of irrigators indicated no intention to change their farming operations.
Around 16 per cent of cotton growers indicated an intention to retire or sell their farm over the next 3 years. This proportion was highest in 2007–08 when 30 per cent of cotton growers indicated an intention to retire or sell their farm.
Over the period 2006–07 to 2014–15 cotton growers that were intending to retire or sell their farm operated smaller farms than the average, while those intending no change to their farming operations operated farms that were larger than the average (Table 1). However, those intending to retire or sell their farm had better than average farm financial performance. Further analysis is required to understand why this is the case.
Note: Average per farm over the period 2006–07 to 2014–15. The results for ‘all other farms’ includes farms not included in the other 2 groups shown in the table.
Source: ABARES Murray–Darling Basin Irrigation Survey
Farm performance and investment
Farm performance
Farm financial performance is a key driver of change in the cotton-growing industry. The main measures of farm financial performance used in this report are farm cash income and rate of return.
Farm cash income is defined as total cash receipts minus total cash costs. It is a short-term measure of the cash surplus available to a farm business to reinvest or draw family income after costs have been taken into account.
Total cash receipts are the cash revenues received by a farm business. In most cases, the largest receipt items are sales of cotton and other broadacre crops. Other (usually minor) items include allocation water sales, contracting and government assistance payments.
Total cash costs are payments made for materials and services and for administration, crop-related expenses, interest, and permanent and casual labour. Capital and household expenses are not included in total cash costs.
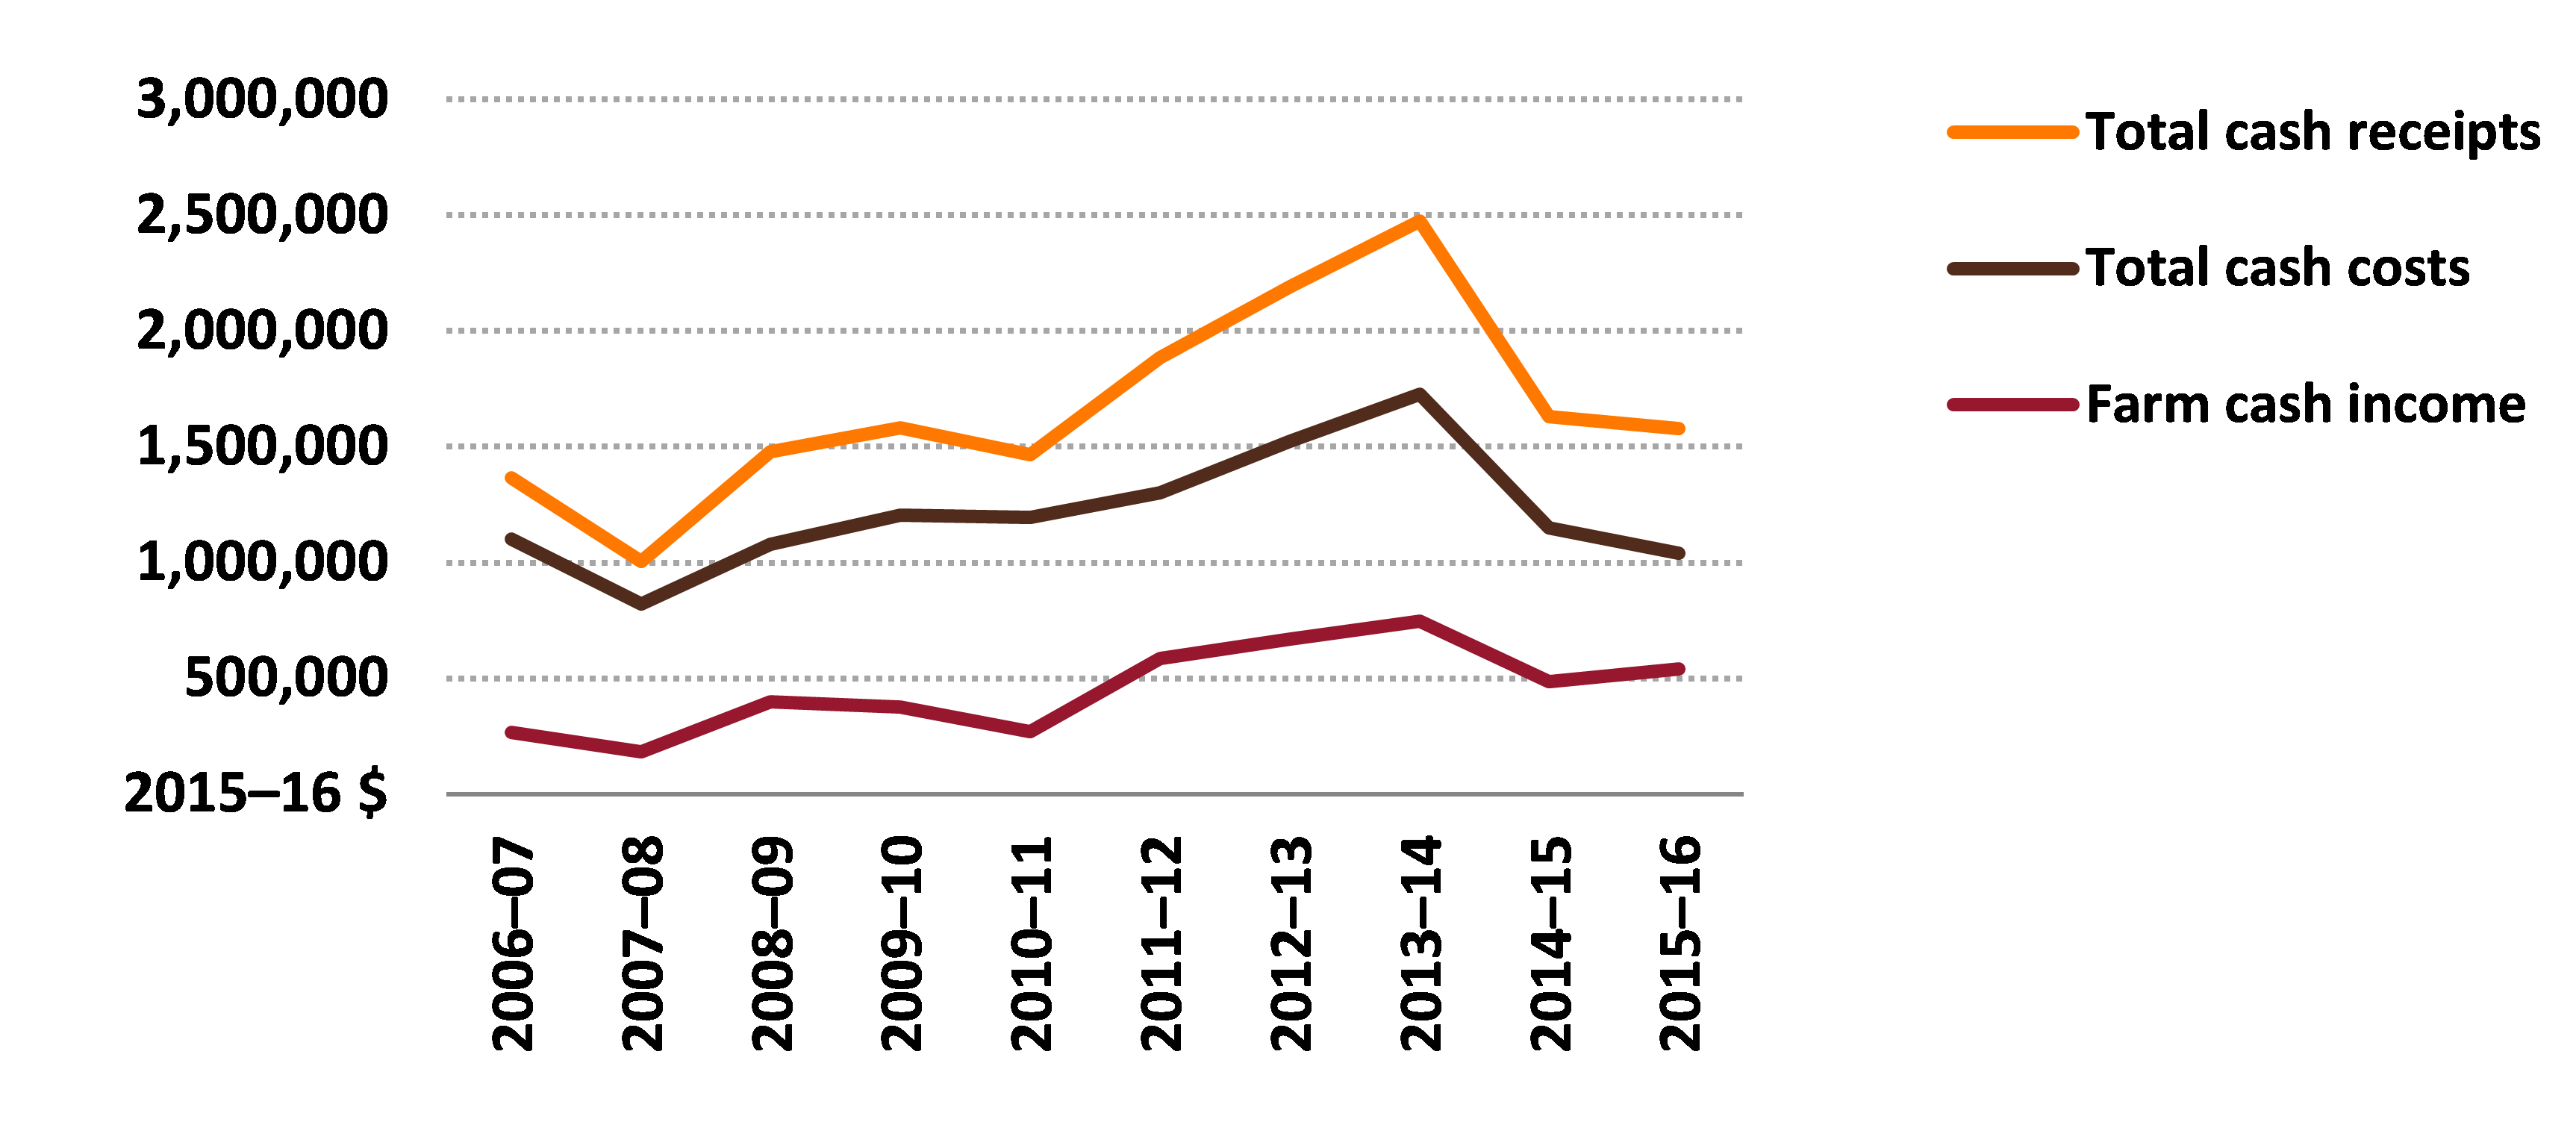
Average farm cash incomes of cotton growers were relatively low from 2006–07 to 2010–11 because of reduced total farm production during the drought (Figure 4). A larger cotton crop was planted in 2010–11 but much of the income from that crop was received in the 2011–12 financial year. Higher total cash receipts as a result of higher crop production led to a significant rise in farm incomes in 2011–12. However, cotton farm cash incomes fell after 2013–14 in response to falling cotton prices, higher costs and reduced crop production because of a return to drier seasonal conditions. In 2015–16 average farm cash income of cotton farms is estimated to have increased by around 11 per cent (in real terms). Although total cash receipts declined in 2015–16, by around 3 per cent, total cash costs decreased by a larger proportion (around 10 per cent)—mainly because of reduced expenditure on fuel, contracts and repairs and maintenance.
average per farm
Source: ABARES Murray–Darling Basin Irrigation Survey
Components of receipts
Receipts from cotton sales as a proportion of total cash receipts varied over the survey period, reflecting cotton growers’ flexibility to plant different crops. For example, cotton (irrigated and dryland) accounted for just over 40 per cent of total receipts in 2006–07 compared with just over 60 per cent in 2011–12 (Figure 5). The other major crops grown on cotton farms are wheat and grain sorghum.
average per farm

Source: ABARES Murray–Darling Basin Irrigation Survey
Components of costs
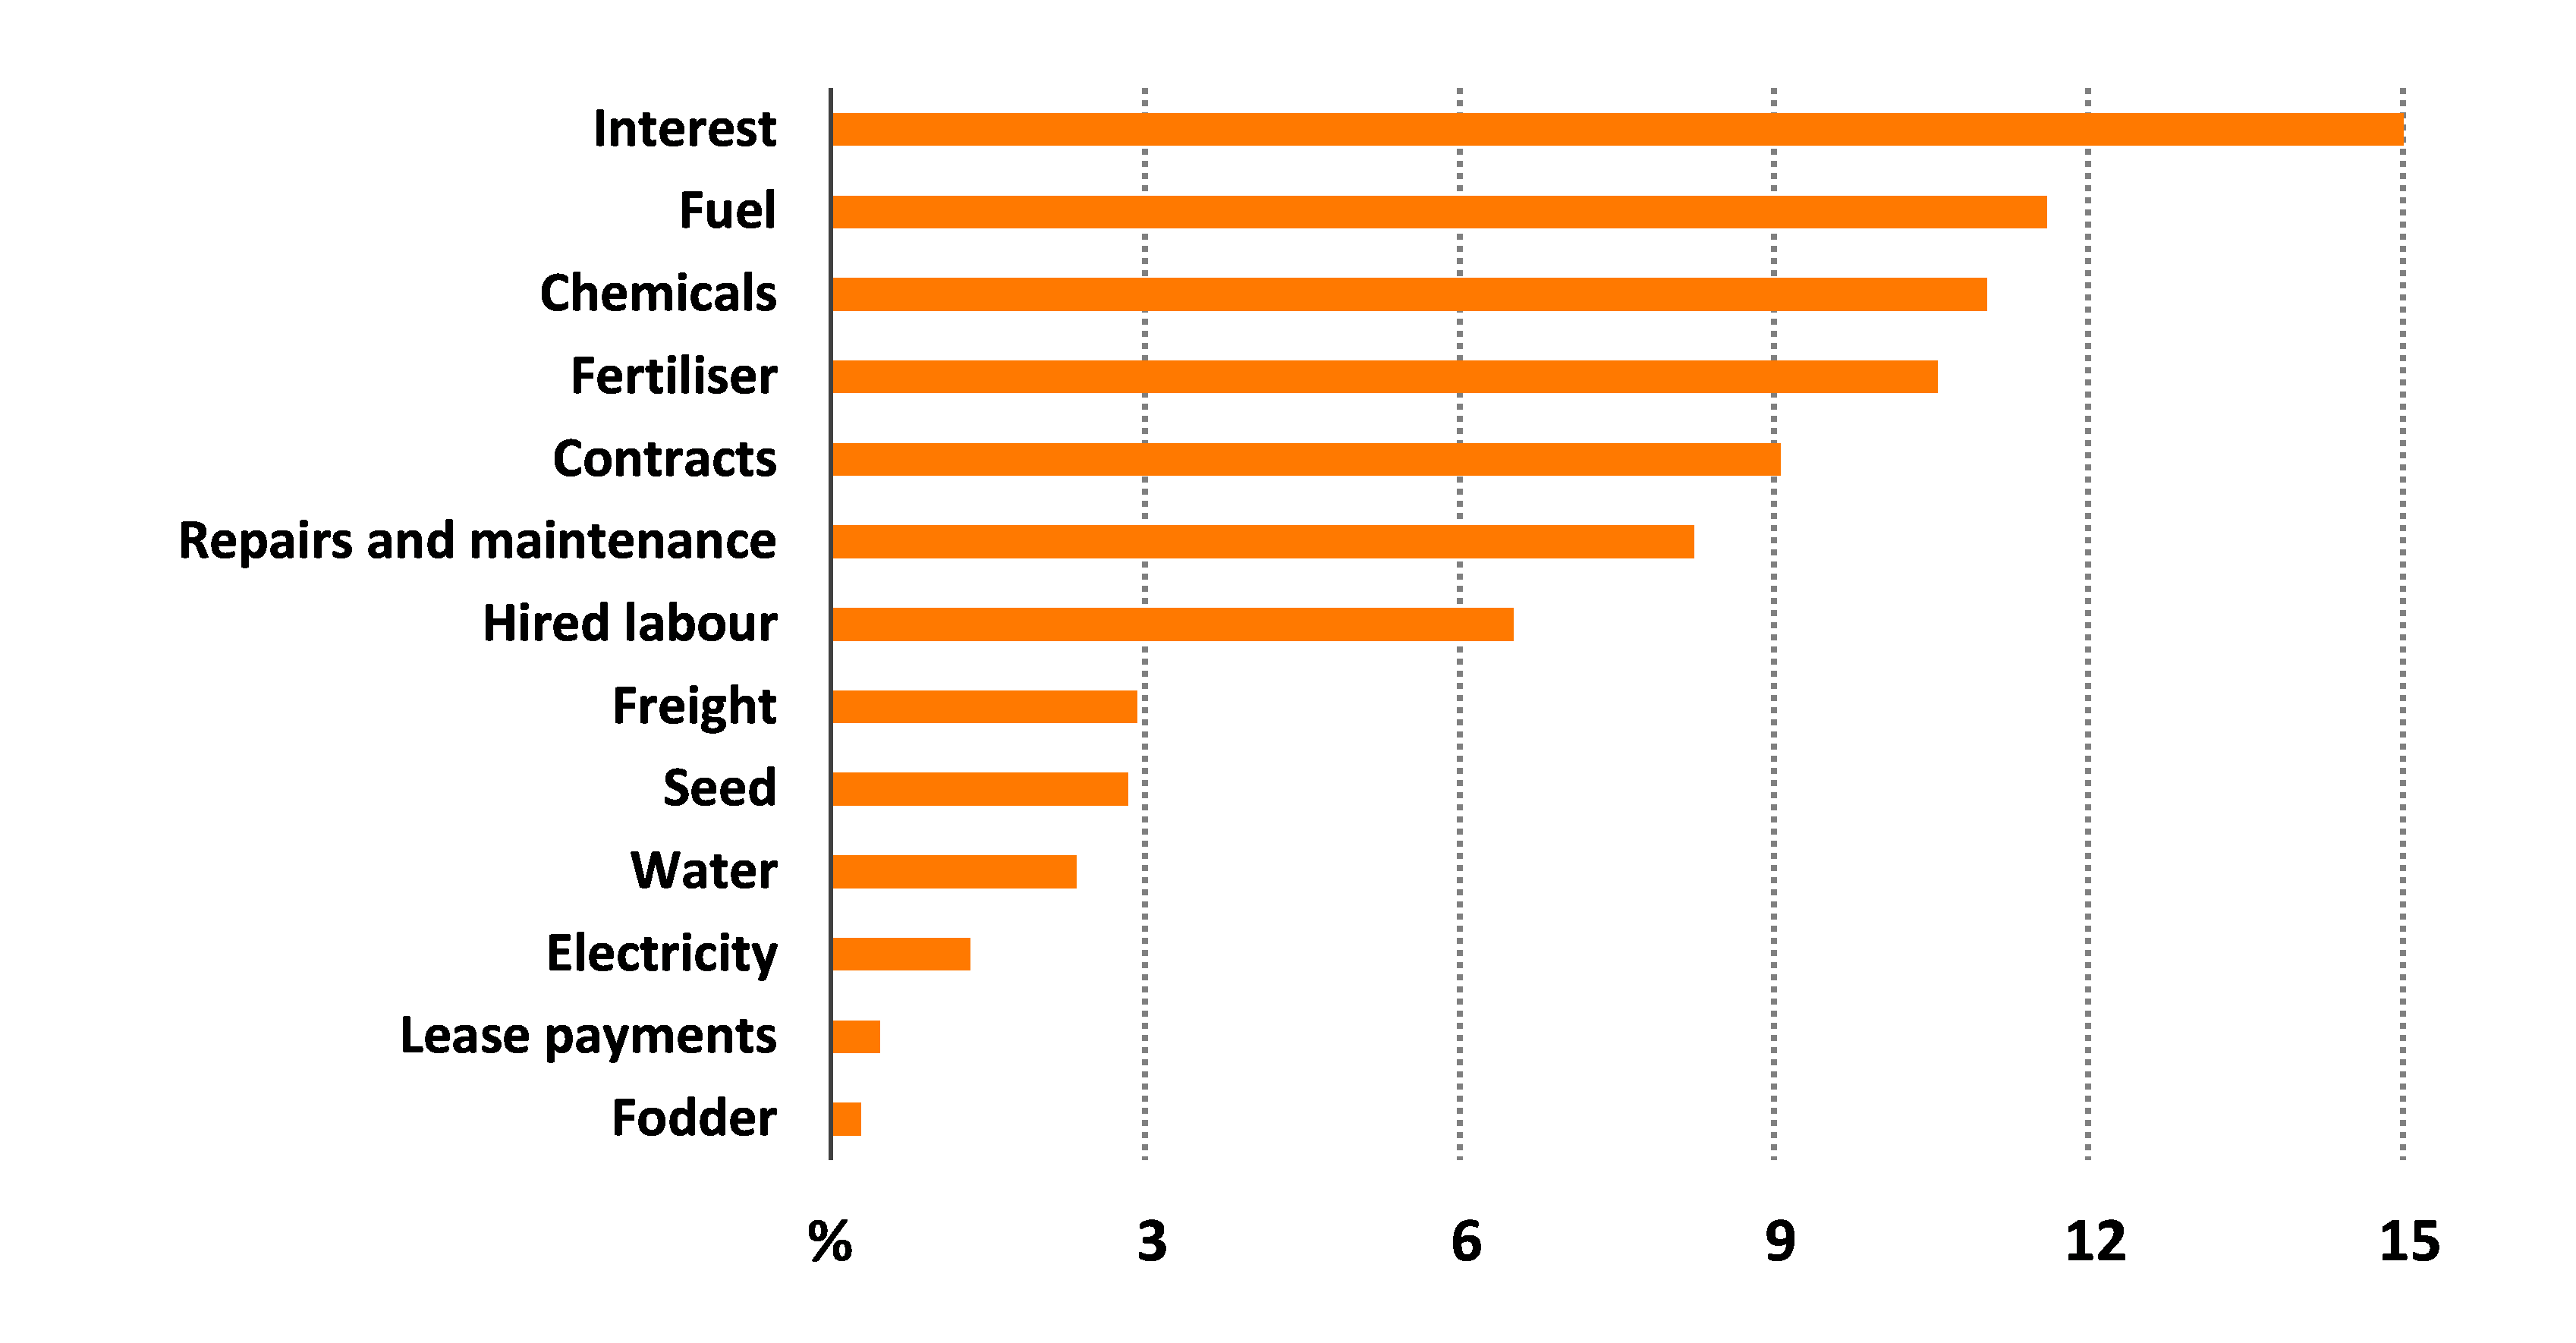
Many cotton farm costs are directly related to cropping activities so tend to change in proportion to changes in cropping areas. When averaged over all survey years, four of these types of costs (fuel, chemicals, fertiliser and contracts) were in the top five cash costs incurred on cotton farms (Figure 6).
average per farm
Rate of return
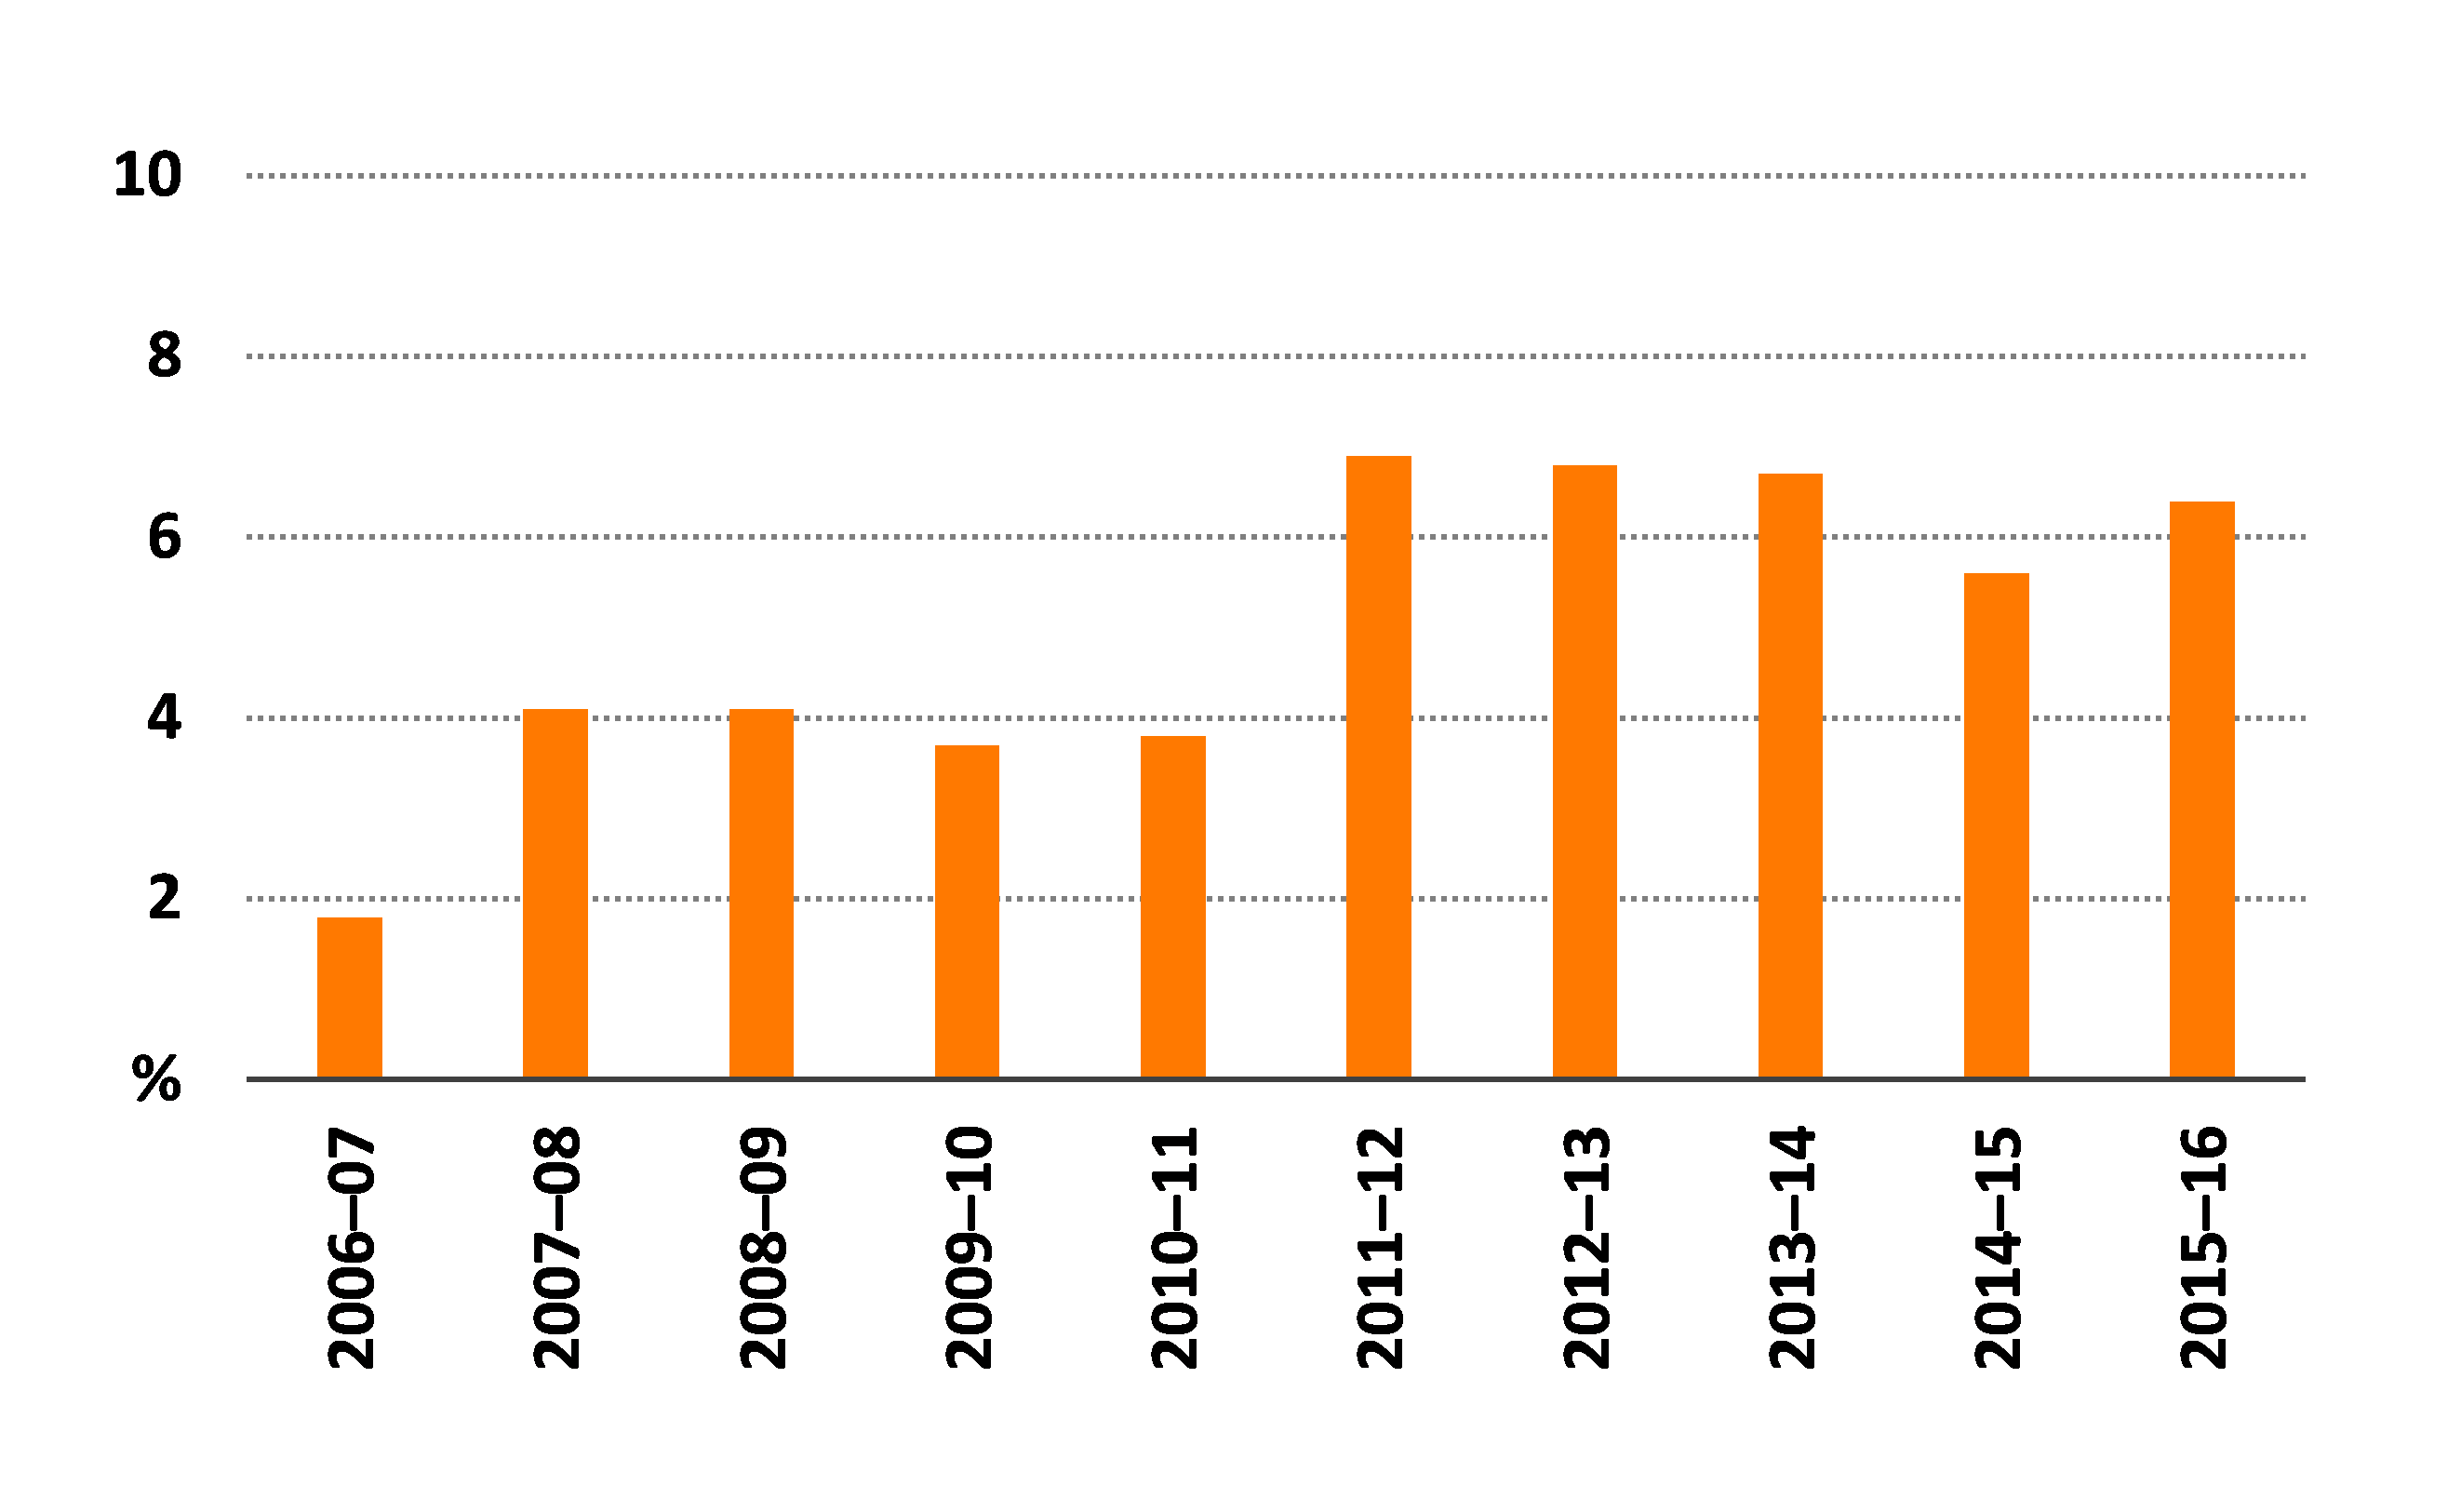
Figure 7 shows the average annual rate of return to capital (excluding capital appreciation) for cotton farms. Rate of return is a measure of the annual profit generated by a business, expressed as a percentage of the value of the capital used to generate that profit. Because it is expressed as a ratio, the rate of return for cotton farms can be compared with the rate of return for other farm types or other potential investments. For example, the average rate of return for broadacre farms in 2014–15 was 1.4 per cent (Martin 2016).
The estimated average rate of return (excluding capital appreciation) for cotton growers was estimated to have been 5.6 per cent in 2014–15 and 6.4 per cent in 2015–16, compared with an average of 6.7 per cent in 2013–14 (Figure 7). The average rate of return for cotton-growing farms over the entire period of the survey—from 2006–07 to 2015–16—was 5 per cent.
Despite declines in farm financial performance from 2013–14 to 2014–15, the proportion of cotton farms with a positive rate of return remained relatively high at around 88 per cent. In 2015–16 around 24 per cent of cotton growers recorded rates of return higher than 10 per cent.
average per farm
Source: ABARES Murray–Darling Basin Irrigation Survey
Farm investment
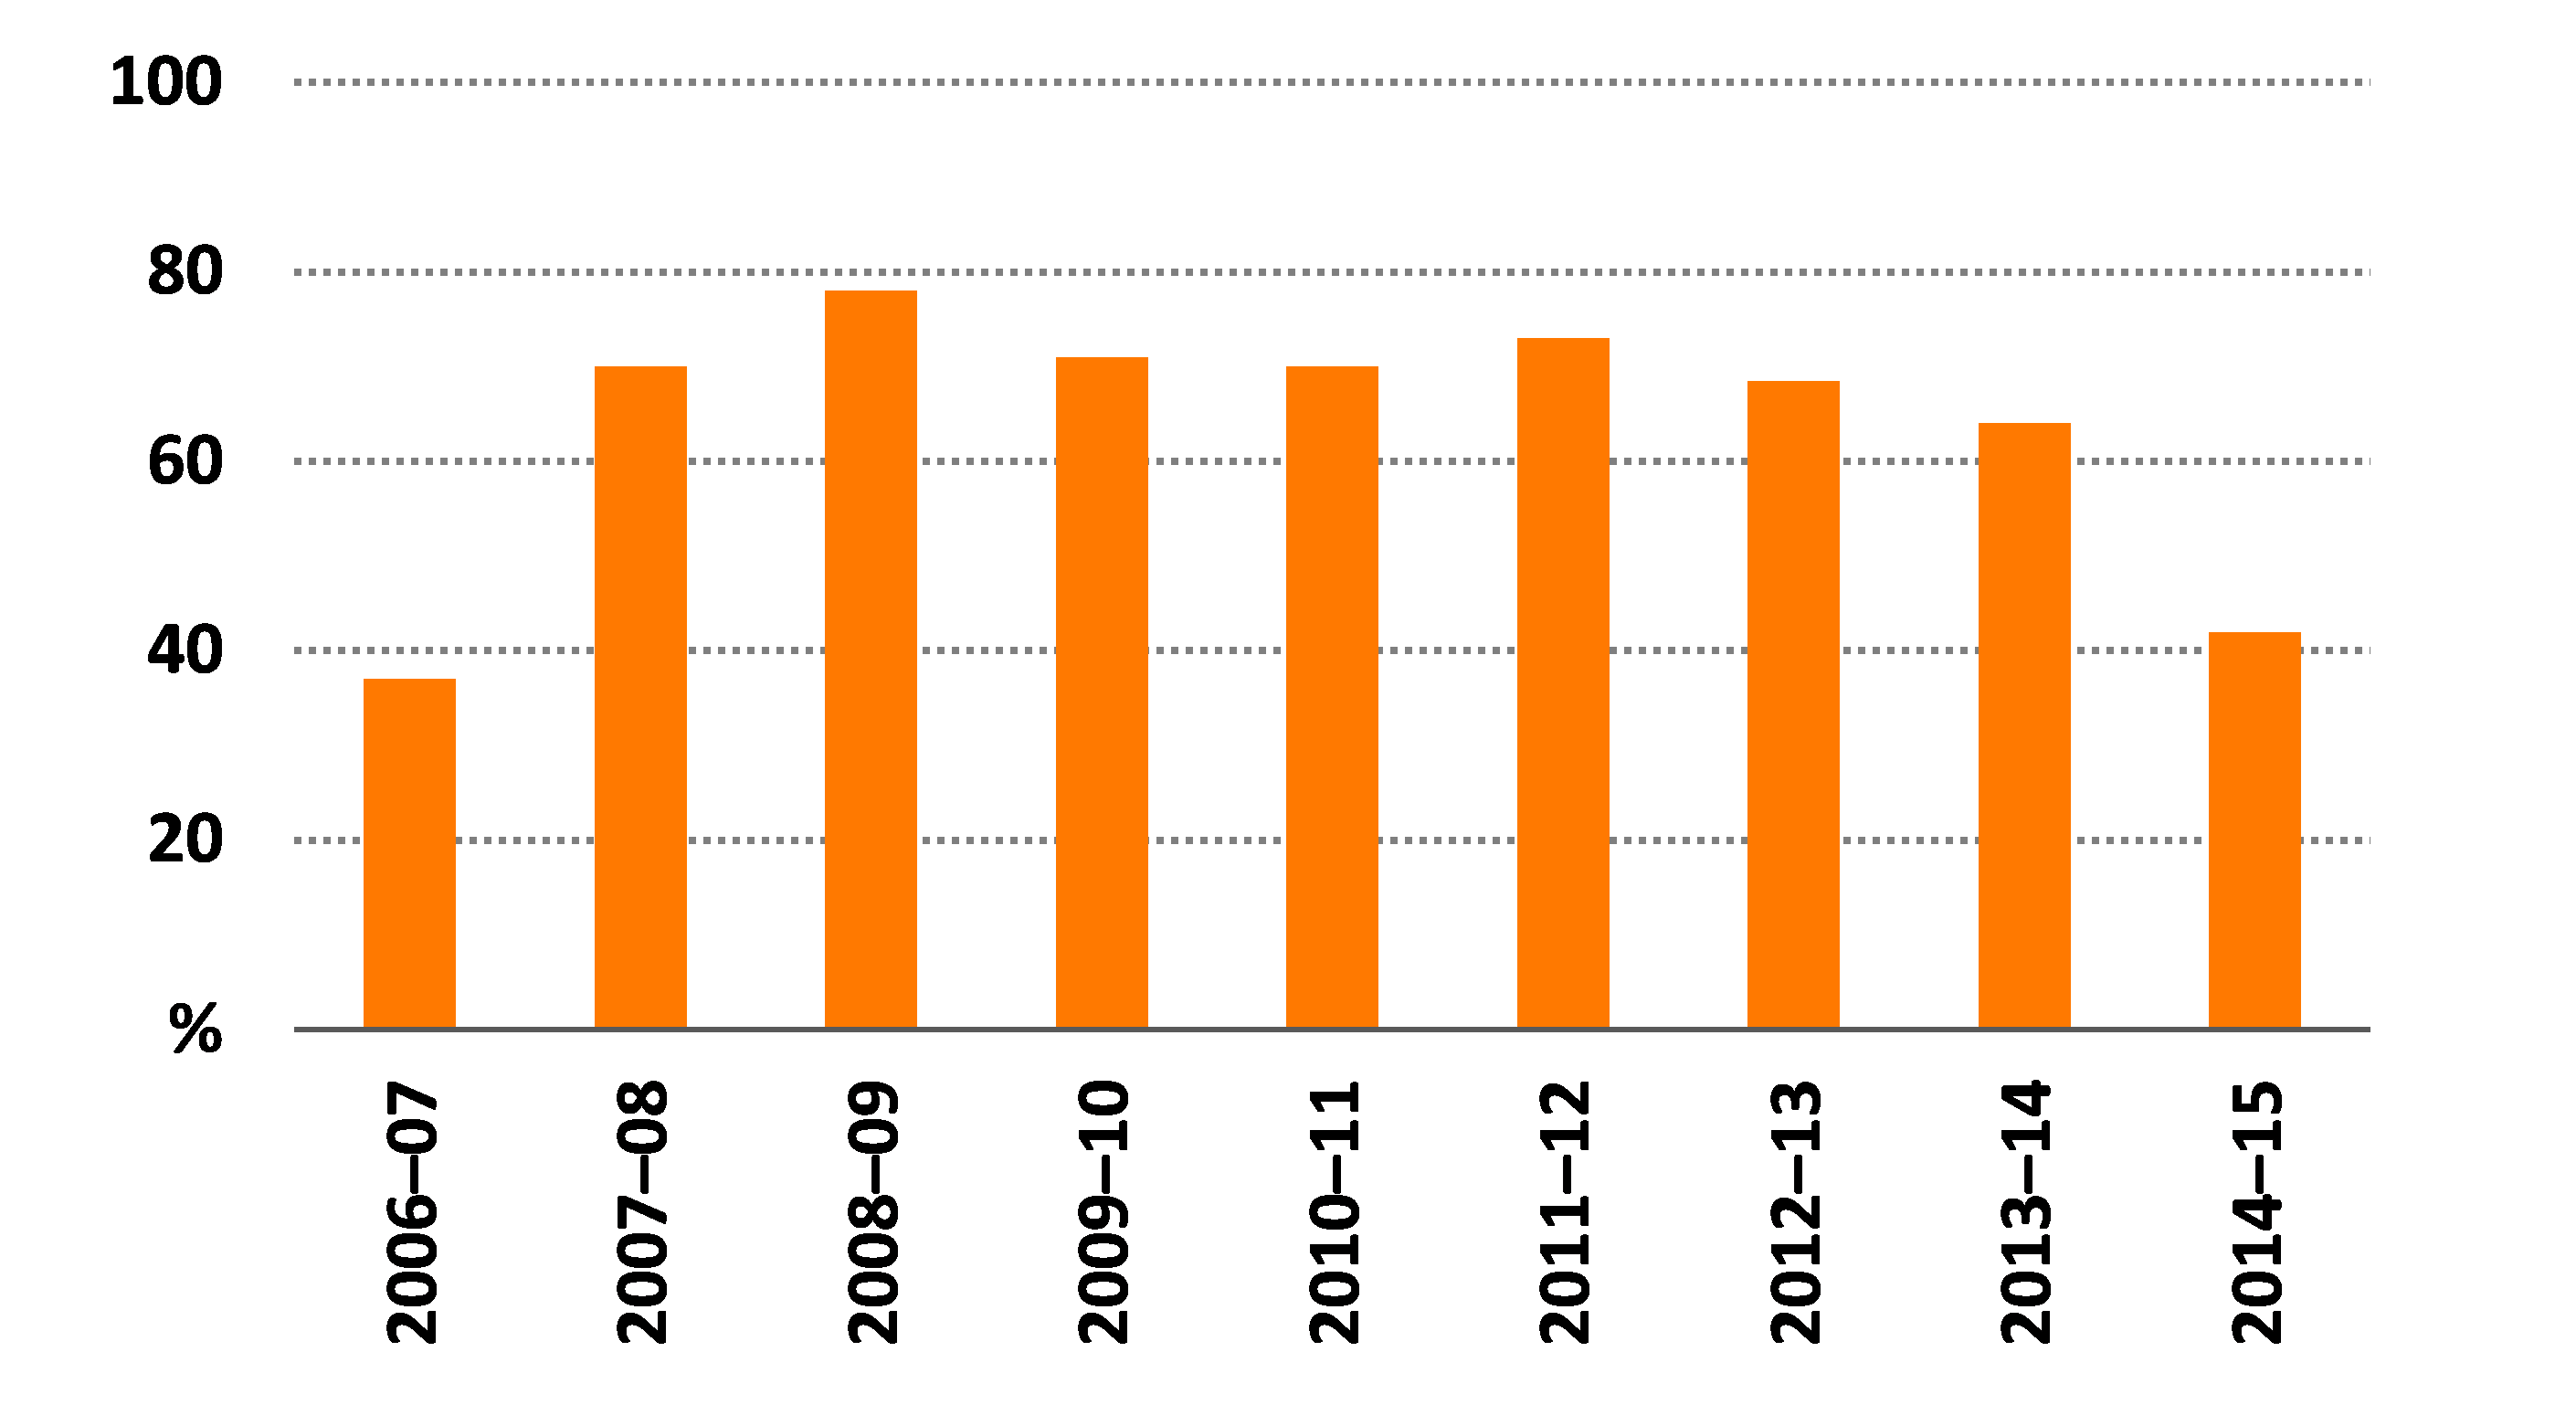
Around 60 per cent of cotton growers each year, on average, made new capital investments over the period 2006–07 to 2014–15, ranging from a low of 37 per cent in 2006–07 to around 78 per cent in 2008–09 (Figure 8).
In 2014–15 the average total capital additions was around $420,000 per cotton farm for those cotton growers making additions. Additions to plant and equipment (including irrigation infrastructure) accounted for around 57 per cent of capital additions in 2014–15 and land accounted for 42 per cent.
average per farm
Water use and irrigation technology
Cotton growers in the Murray–Darling Basin use irrigation water to supplement rainfall. Using irrigation water provides higher and more reliable crop yields than relying solely on highly variable seasonal rainfall.
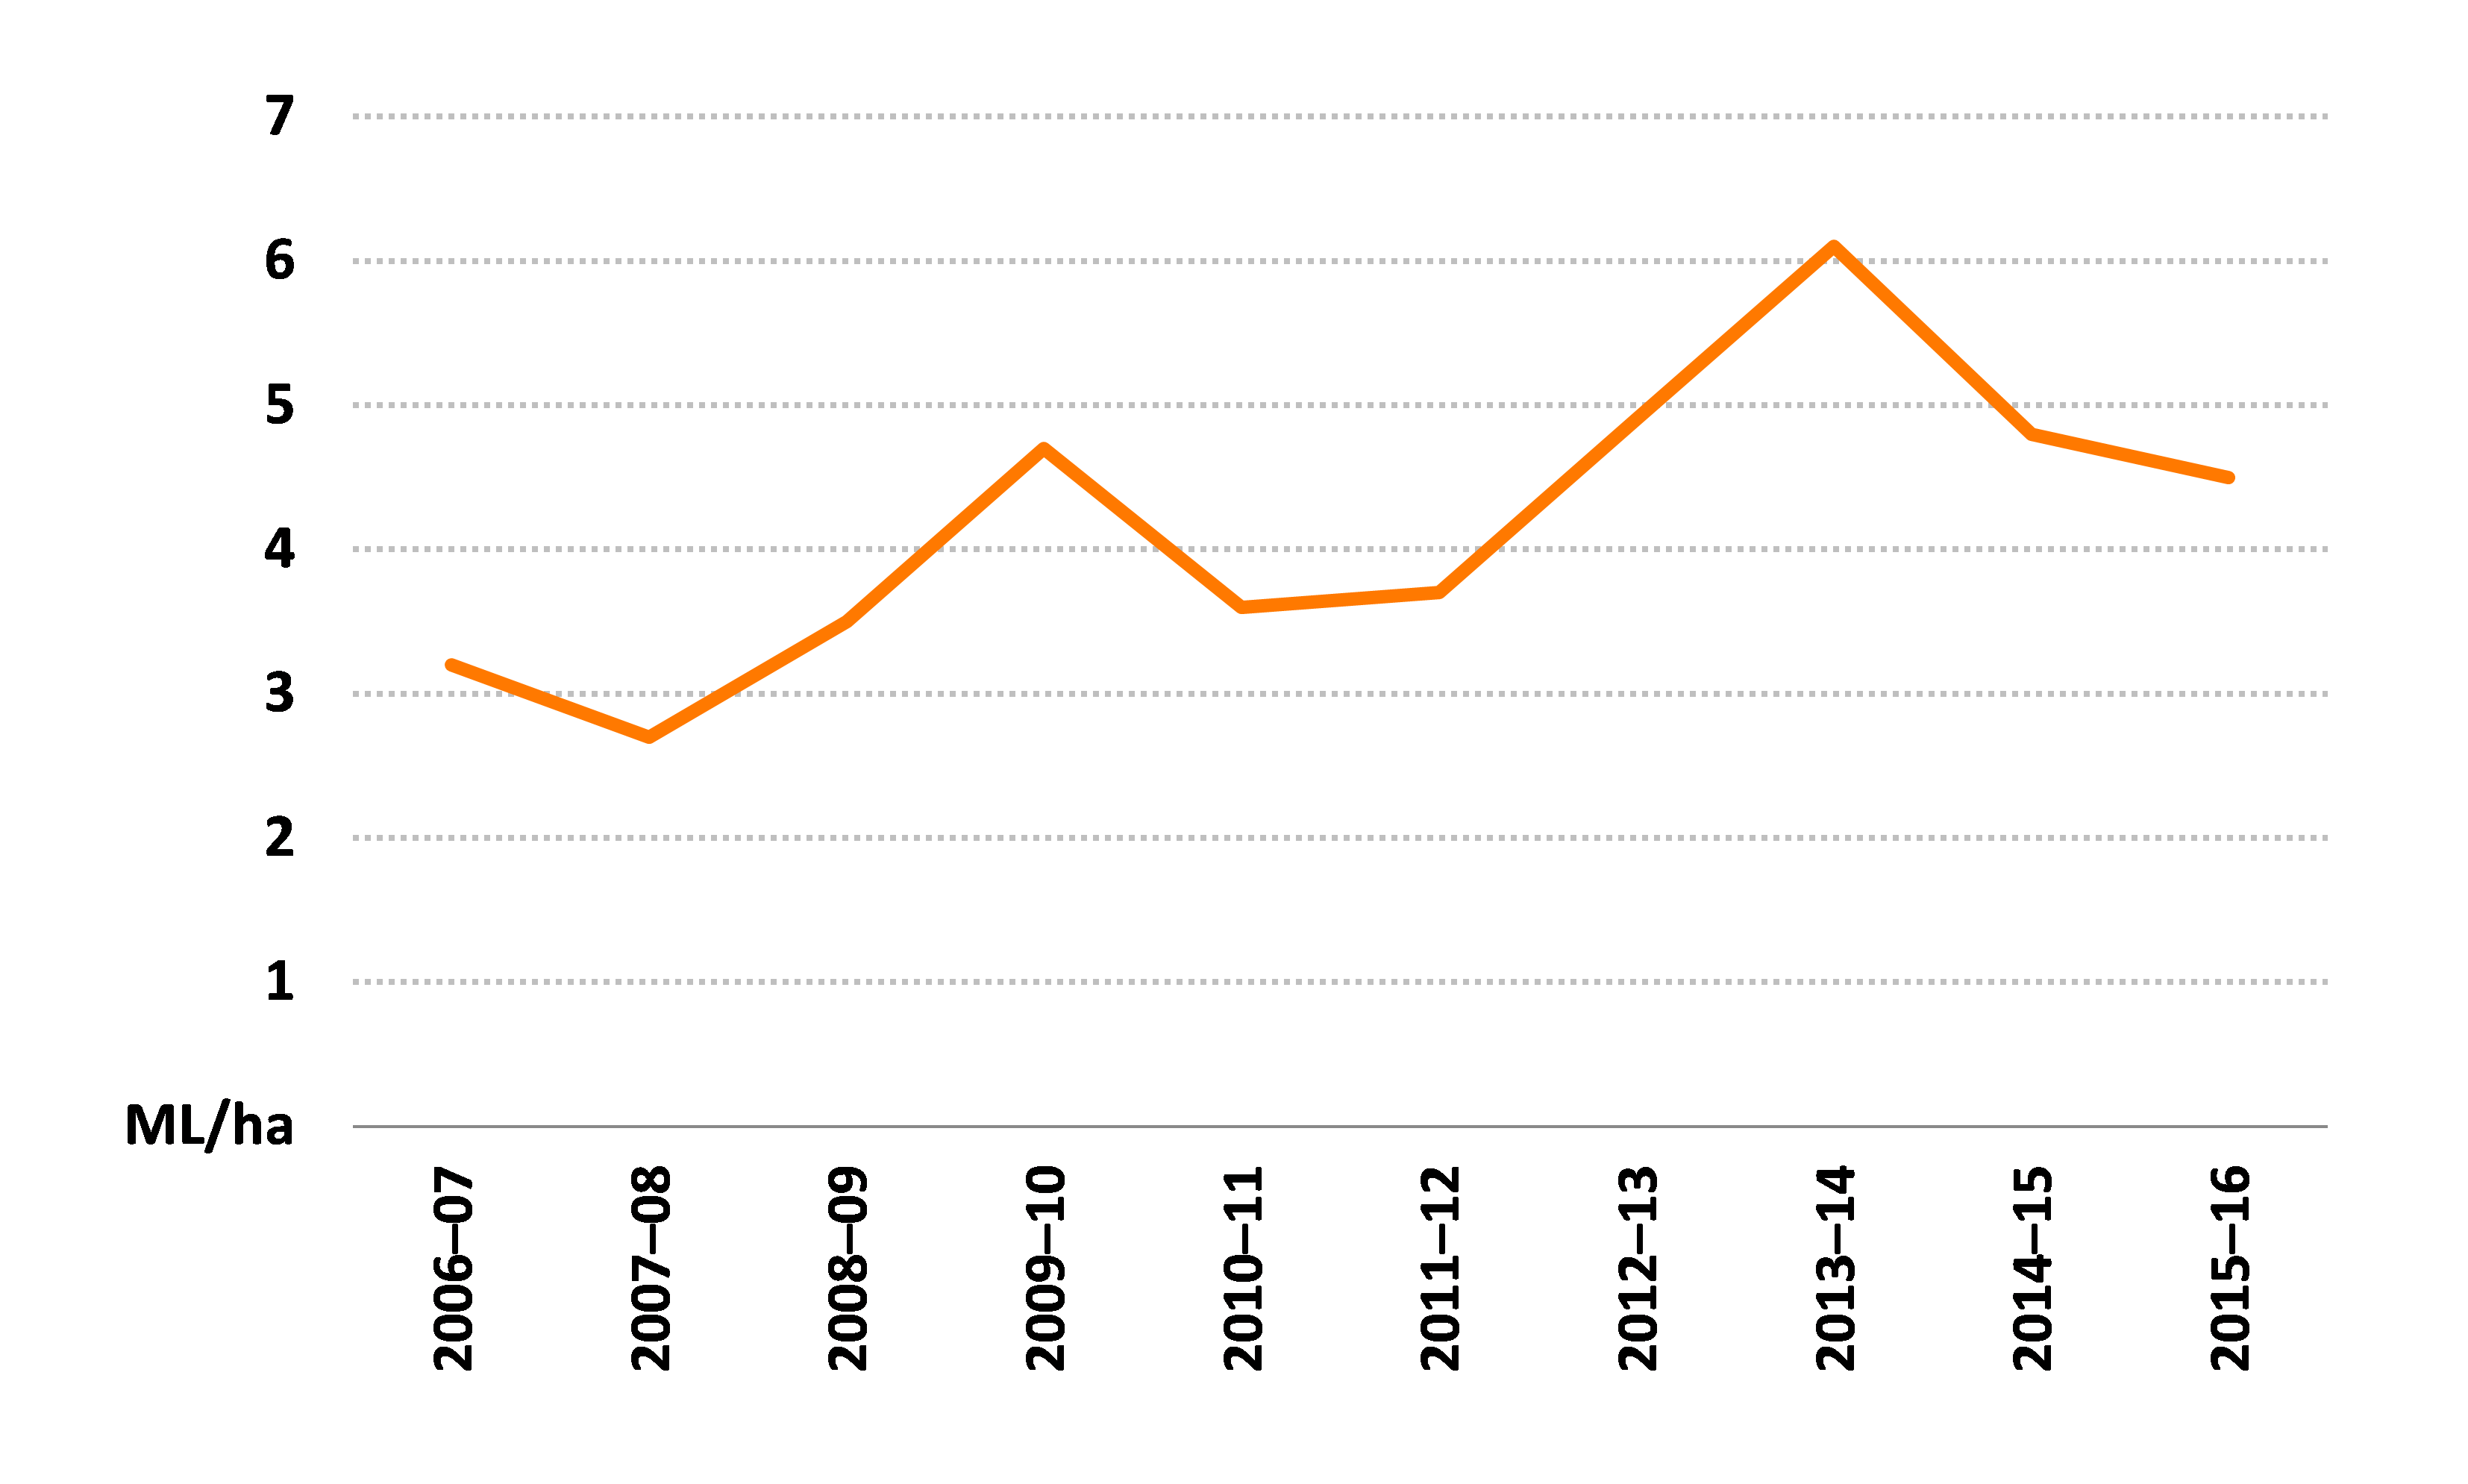
The average volume of irrigation water used per hectare on cotton rose sharply from 2007–08 to 2013–14 (Figure 9). This reflected increased water availability over the period 2009–10 to 2013–14. With the onset of drier conditions in 2014–15 the average per hectare volume of irrigation water used on cotton fell sharply and continued to decline, but at a lesser rate, in 2015–16.
It is difficult to draw firm conclusions about changes in water application rates because of the relatively short time series available and the extreme drought conditions in the early survey years. Broadly, changes in average water application rates reflect the combination of changes in the total volume of irrigation water applied and changes in seasonal conditions (including rainfall, temperature and evapotranspiration).
average per farm
Source: ABARES Murray–Darling Basin Irrigation Survey
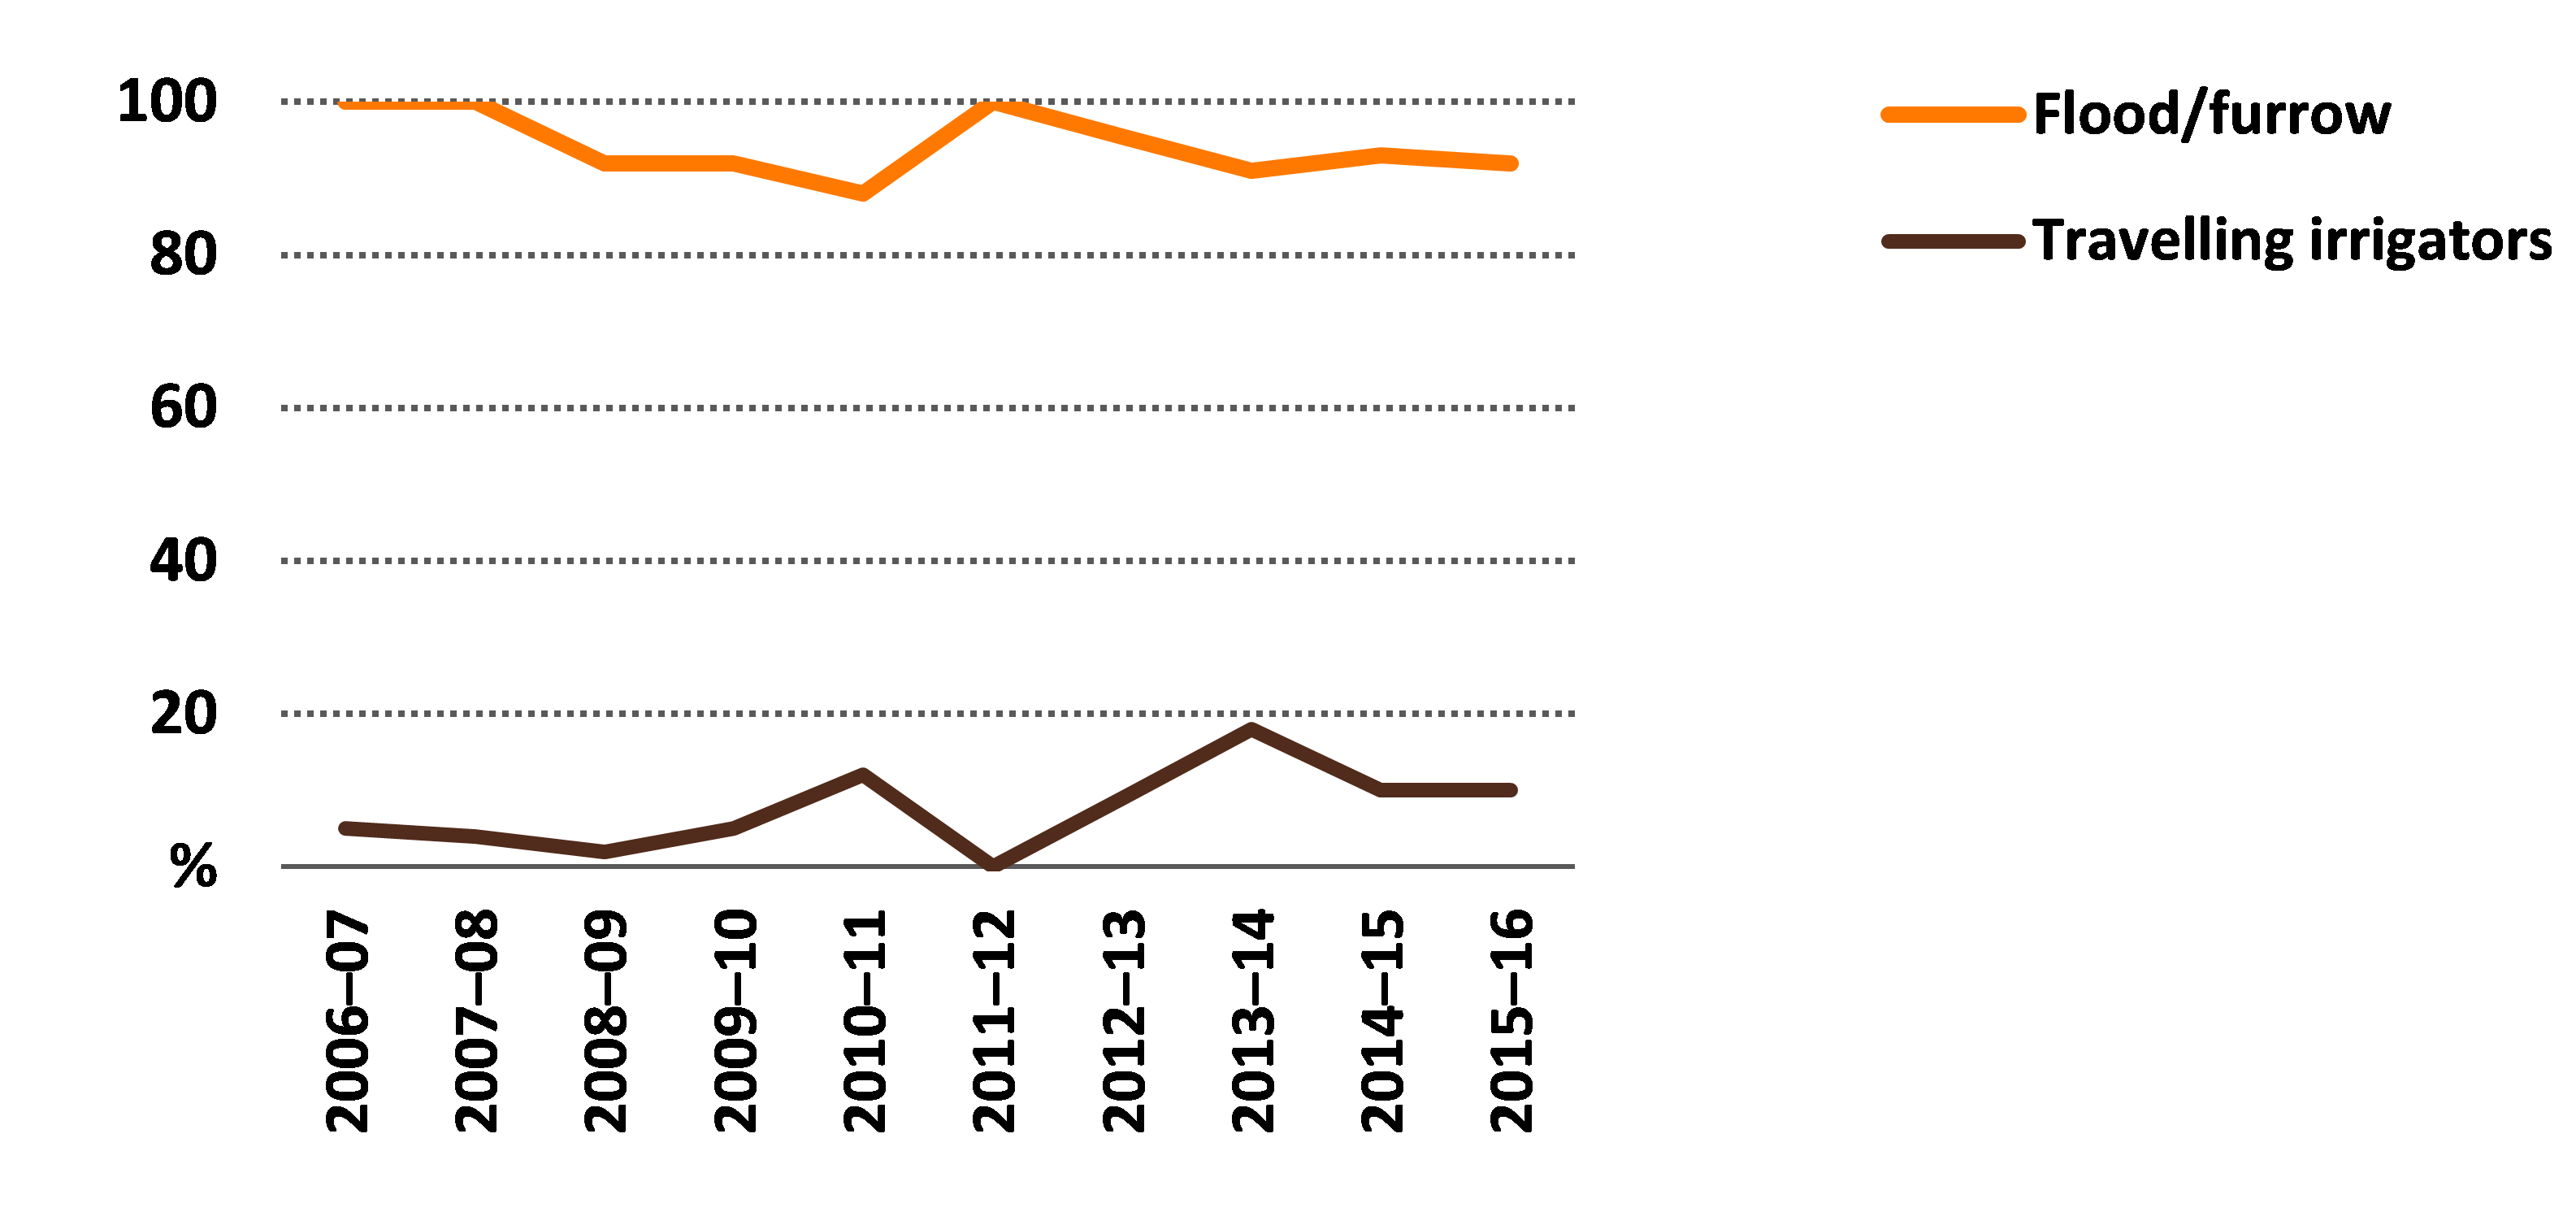
Across the Murray–Darling Basin, flood/furrow systems were the most common irrigation technology used on cotton farms across a range of crops (Figure 10). However, the proportion of farms using various technologies in any given year is affected by the types of crops grown on cotton farms. The survey data indicate that some individual farms have moved away from flood/furrow systems towards travelling irrigator systems.
proportion of farms
Source: ABARES Murray–Darling Basin Irrigation Survey
Water trading
Water trading provides cotton-growing farmers with a tool for managing their farm businesses. However, water trading (of both seasonal allocations and permanent entitlements) occurs less in the northern regions of the Murray–Darling Basin than in the southern regions because of the limited connectivity of the northern river systems.
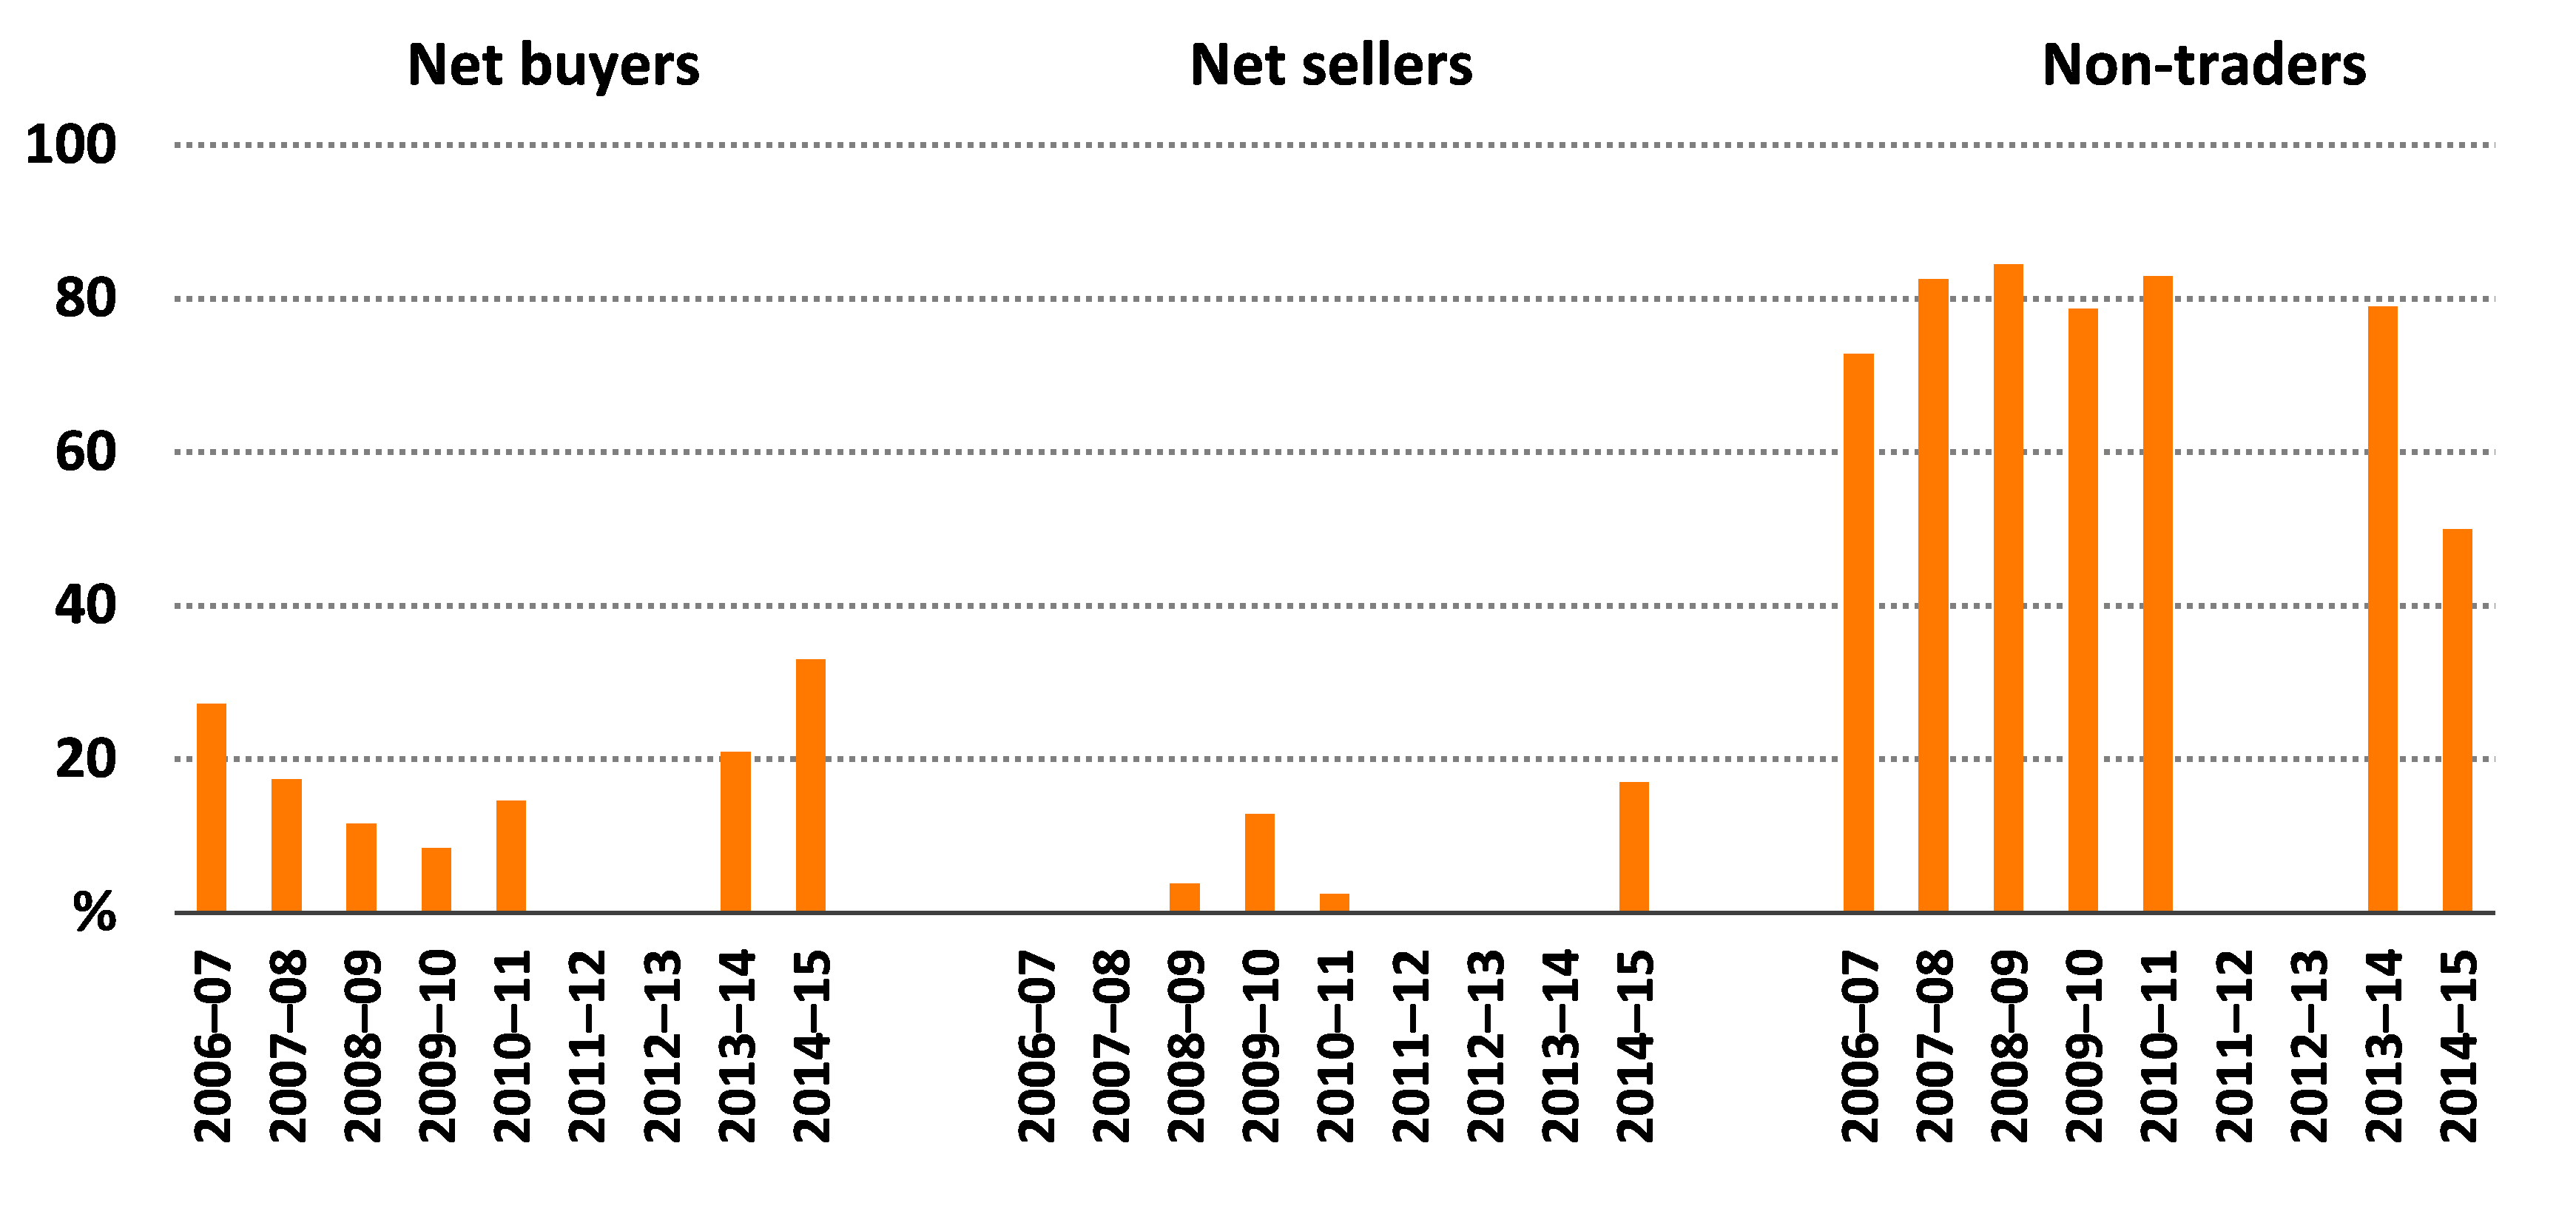
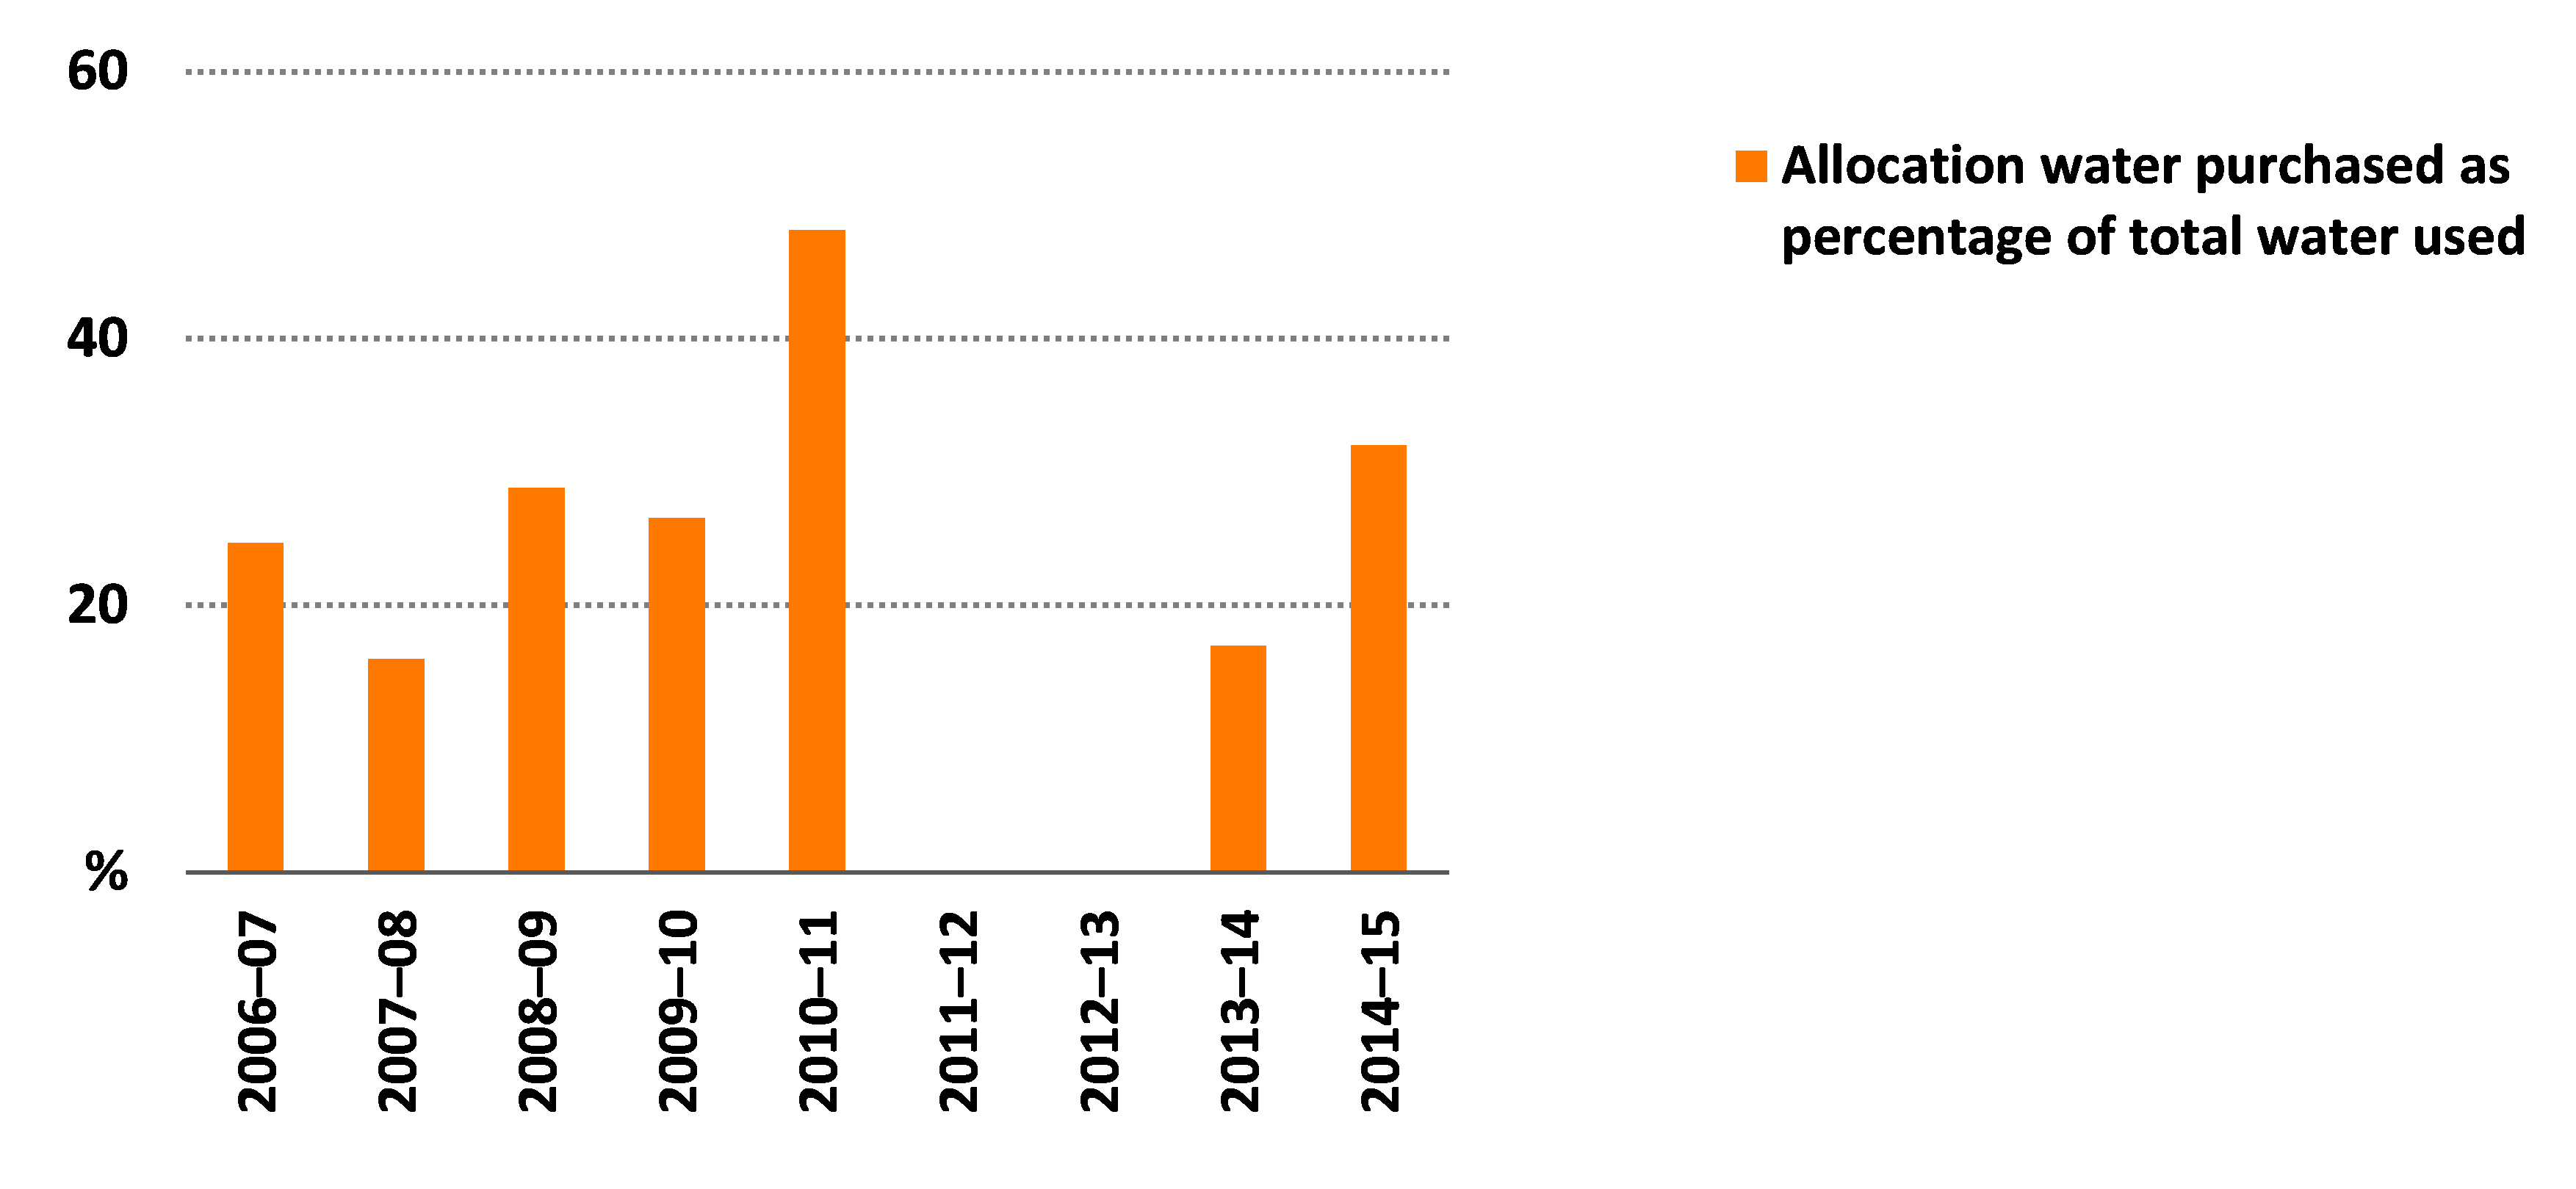
Over the period 2006–07 to 2014–15 most cotton farms did not trade water (Figure 11). In some drier years, particularly 2006–07, 2013–14 and 2014–15, just over 25 per cent of farms made net purchases of allocation water (that is, purchased more than they sold). On average, water purchases by these net buyers accounted for around 25 per cent of water used on those farms on average (Figure 12). In 2010–11, when water was more plentiful, allocation water purchases by net buyers accounted for almost 50 per cent of their total water use.
proportion of farms
Source: ABARES Murray–Darling Basin Irrigation Survey
The market for permanent water access entitlements also provides irrigators with a tool for managing their farm businesses, although the proportion of cotton growers trading entitlements each year has been small (less than 2 per cent).
Source: ABARES Murray–Darling Basin Irrigation Survey
References
ABARES 2015, Agricultural commodity statistics 2015, Australian Bureau of Agricultural and Resource Economics and Sciences, Canberra, December.
ABARES 2016, Agricultural commodities: September quarter 2016, Australian Bureau of Agricultural and Resource Economics and Sciences, Canberra, September.
ABS 2016a, Gross value of irrigated agricultural production, 2014–15, cat. no. 4610.0.55.008, Australian Bureau of Statistics, Canberra, September.
ABS 2016b, Water use on Australian farms, 2014–15, cat. no. 4618.0, Australian Bureau of Statistics, Canberra, May.
ABS 2017, Water use on Australian farms, 2015–16, cat. no. 4618.0, Australian Bureau of Statistics, Canberra, July.
Martin, P 2016, ‘Farm performance: broadacre and dairy farms, 2013–14 to 2015–16’, in Agricultural commodities: March quarter 2016, Australian Bureau of Agricultural and Resource Economics and Sciences, Canberra, March.
Data and other resources
| Document | Pages | File size |
|---|---|---|
Cotton farms in the Murray-Darling Basin – Figures 2017 XLSX | 552 KB |
If you have difficulty accessing this file, visit web accessibility for assistance.
Previous reports
Cotton farms in the Murray-Darling Basin, 2012-13 to 2014-15
