
Snapshot of Australian Agriculture 2025
This Insights report describes the current state of Australian agriculture, with the aim of providing key information and statistics in one place. It covers eight key aspects of Australian agriculture: its role in the broader economy, trends in production, farm incomes, industry structure and productivity, climate change impacts and risk management, agricultural employment, sustainability and trade.
If you have difficulty accessing these files, visit web accessibility for assistance.
Gross value of agricultural production to rise
Australian agriculture accounts for (Figure 1):
- 55% of Australian land use (426 million hectares, excluding timber production, in December 2023)
- 74% of water consumption (9,981 gigalitres used by agriculture in 2021–22)
- 10.8% of goods and services exports ($71.5 billion in 2023–24)
- 2.4% of value added (GDP) in 2023–24
- 5.9% of rural employment and 2.2% of national employment (315,600 people in 2023–24).
The mix of Australian agricultural activity is determined by climate, water availability, soil type and proximity to markets. Livestock grazing is widespread, occurring in most areas of Australia, while cropping and horticulture are generally concentrated in areas relatively close to the coast (Figure 2).
Figure 1 Australian agriculture’s share of national economic and environmental indicators

*Includes agriculture, fisheries and forestry, otherwise only referring to agriculture.
Source: ABARES (2024b); ABS (2023b, 2024b, 2024c, 2024d, 2025)
Figure 2 Australian agricultural production zones
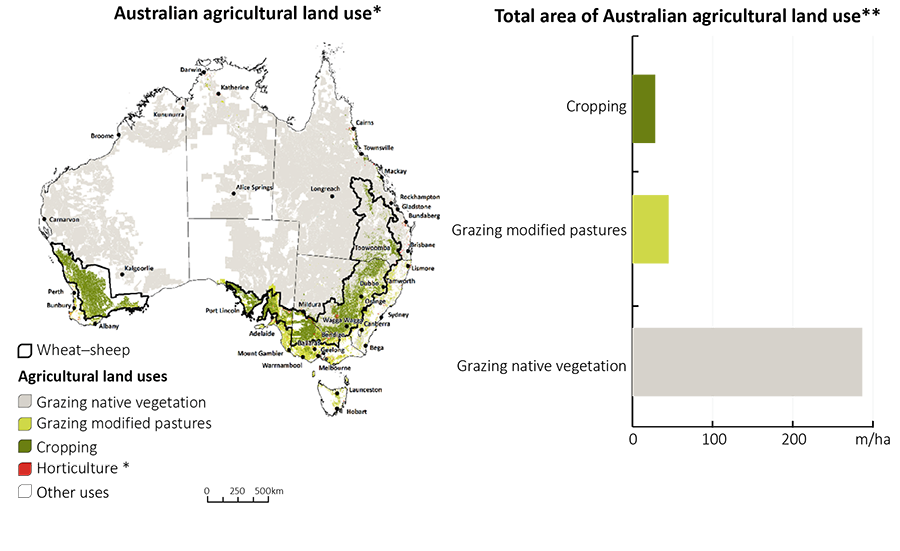
** Horticulture not represented as it is less than 1 million hectares of agricultural land use
Source: Wheat-sheep zone – Australian Agricultural and Grazing Industries Survey, 2016, ABARES; Catchment scale land use of Australia – update December 2023, ABARES; ABS Agricultural Commodities, Australia, 2020–21 (cat 7121)
Agriculture accounts for over half of Australia’s land use therefore the sustainable management of this land is an important issue for both farm businesses and the general public. There are many sustainable land practices that have become standard for Australian farmers (Coelli 2021). For example:
- Most broadacre cropping farms retain stubble (85% of farms), minimise tillage (68% of farms) and optimise the use of (and reduce reliance on) pesticides or fertiliser (65% of farms)
- Most livestock farms are using a variety of grazing management systems such as cell, strip or rotational grazing (61% of farms) and setting a long-term groundcover requirement (61% of farms).
Australia has a diverse agricultural, fisheries and forestry sector, producing a range of crop and livestock products (Figure 3). Three successive years of record-breaking production value from 2020–21 to 2022–23 were underpinned by extremely favourable climate conditions and strong commodity prices on average across agricultural products. Despite declining in 2023–24, on the back of drier conditions and lower crop prices, agricultural production was still the third highest on record and is forecast to increase again in 2024–25.
The gross value of agricultural production has increased by 34% in the past 20 years in real terms (expressed in 2023–24 dollars) from $61.5 billion in 2004–05 to $82.4 billion in 2023–24. When including fisheries and forestry, the total value of agricultural, fisheries and forestry production has increased by 30% in real terms in the same 20 year period from approximately $67.7 billion in 2004–05 to $88.3 billion in 2023–24 (Figure 4) (see Box 1.2 of the March 2024 Agricultural Commodities Report for further information on real values).
Drivers of growth in the value of output over the past 20 years vary by sector.
- Cropping: producers have improved productivity by adopting new technologies and management practices leading to strong volume growth.
- Livestock: higher prices have been the main driver of growth, reflecting growing demand for protein in emerging countries and some temporary factors, such as drought in the United States and disease outbreaks such as African Swine Fever in meat importing countries.
Figure 3 Agriculture, fisheries and forestry value of production, by commodity, 2023–24
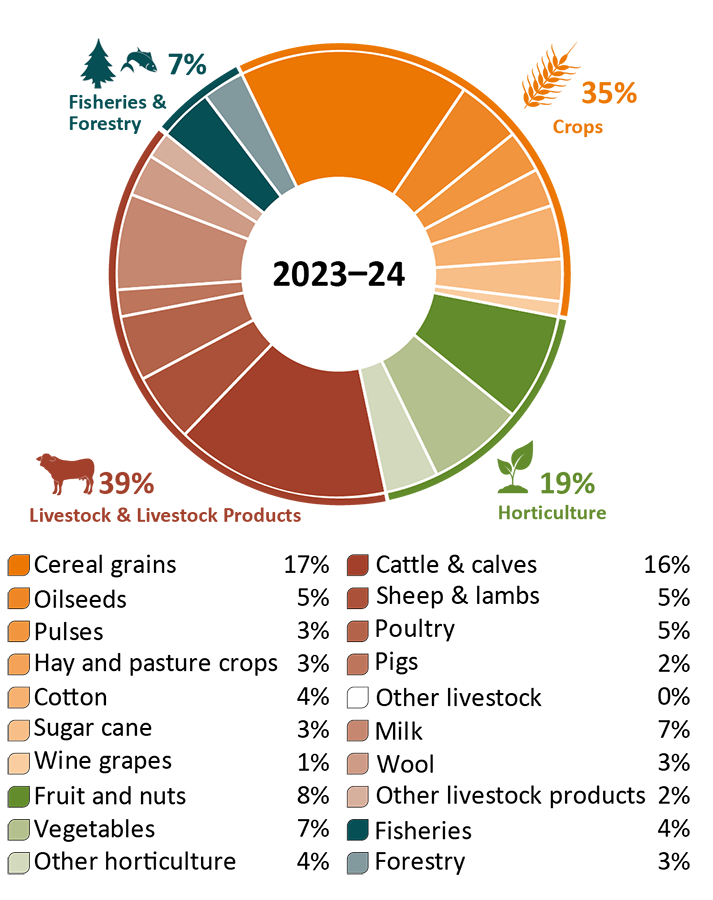
Source: ABARES (2024a)
Figure 4 The value of Australian agriculture, fisheries and forestry production remains elevated
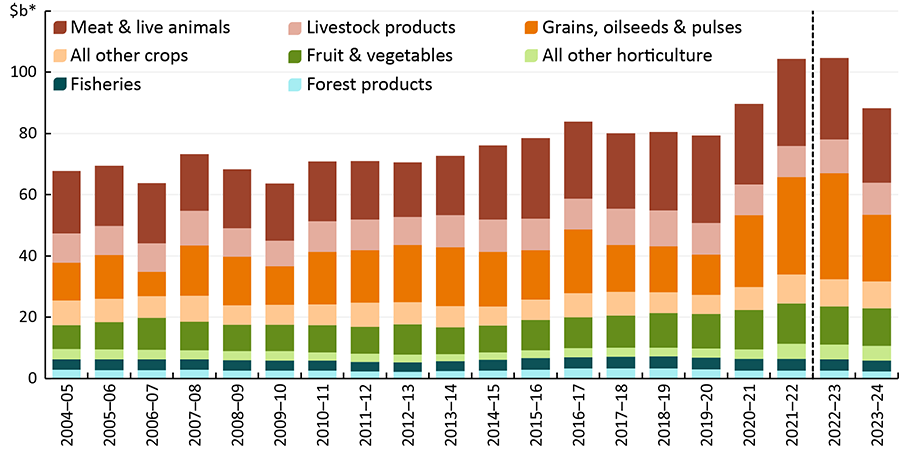
Source: ABARES (2024a); ABS (2023a, 2024a, 2025)
Changes in Australian agriculture can be seen through compositional shifts in its output. Over the last 5 decades, production of horticultural commodities, meat, oilseeds and pulses have grown to account for much larger shares of production while wool and milk account for much less (Figure 5).
Figure 5 Agricultural production volumes have shifted towards horticulture, meat, oilseeds and pulses
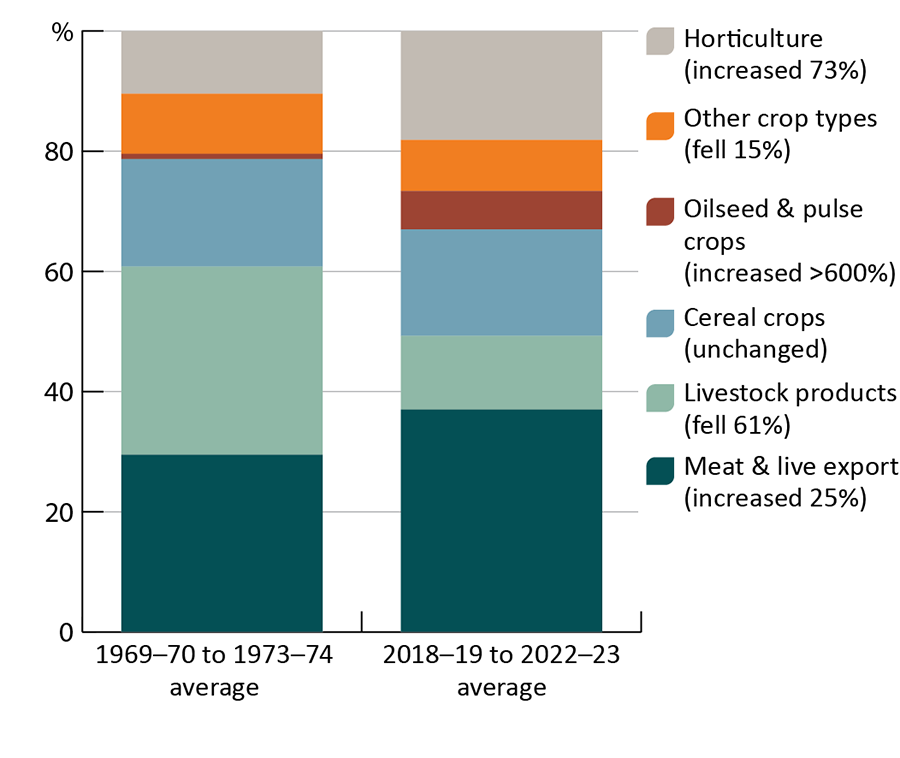
Source: Greenville & Cameron (2022)
In the three years to 2023–24 Australia exported around 70% of the total volume of agricultural, fisheries and forestry production. The export orientation of each industry can vary by commodity type. Wheat and beef, which are large sectors, are more export-focused than dairy, horticulture and pigs and poultry (Figure 6).
In real terms the value of agricultural, fisheries and forestry exports has fluctuated between $45.8 billion and $86.1 billion since 2004–05 (Figure 7). In 2023–24 Australia agricultural, fisheries and forestry exports were valued at $75.6 billion. Grains, oilseeds and pulses have been the fastest-growing export segment, growing at an average annual rate of 9% in real value terms between 2004–05 and 2023–24, followed by other horticulture (excludes fruit and vegetables) (4%), and meat and live animals (4%).
Figure 6 Australian agriculture is export oriented
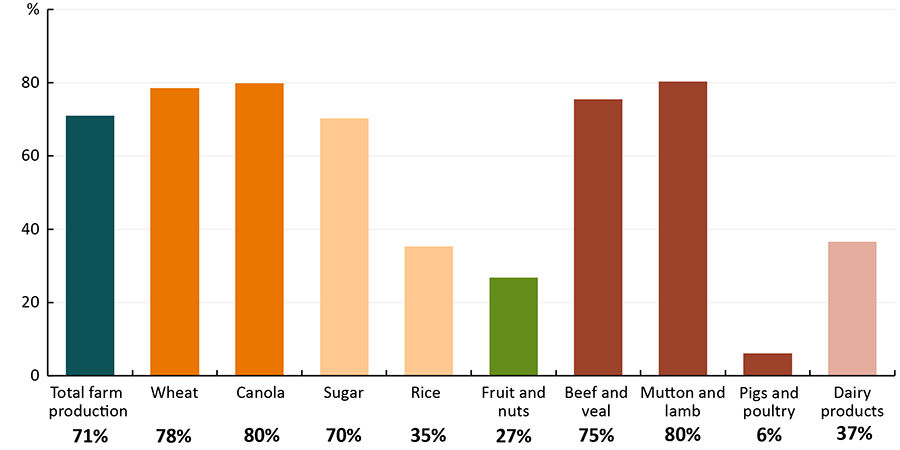
Source: ABARES, following method outlined in Cameron (2017)
Figure 7 China is the biggest single export destination for Australian agriculture, fisheries and forestry exports
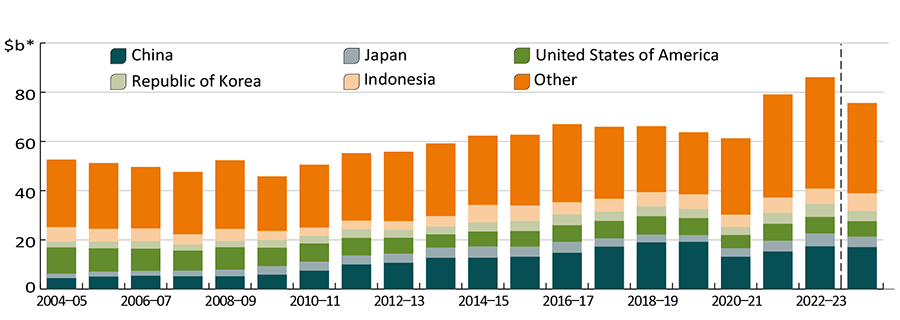
*2023–24 Australian dollars.
Source: ABARES; ABS (2025)
Australia’s biosecurity system reduces the risk of exotic pest and disease incursions and the impact of pests and diseases that are already established. In the absence of these efforts, pests and diseases could cause more harm to people, animals, plants, and the environment. Freedom from many of the world’s major pests and diseases provides agricultural industries with a significant trade advantage and is important for maintaining access to valuable export markets, as well as maintaining productivity.
In 2020, it was estimated that Australia’s biosecurity system has a Net Present Value of A$314 billion (Dodd et al. 2020). Agriculture was the largest beneficiary of the systems operation, estimated to avoid $210 billion in damages over 50 years, from estimated system expenditure of A$10.5 billion.
In the past year biosecurity challenges for agriculture have continued to evolve. Varroa mite, a parasite that affects European honeybees that are essential for the pollination of many horticultural crops, continued to spread in New South Wales and was also detected for the first time in Victoria (ABARES 2024d).
Horticulture has also been threatened by an outbreak of Tomato Brown Rugose Fruit Virus (Tobamovirus fructirugosum) (ToBRFV), which is currently under eradication (ABARES 2024a). Outbreaks of Avian Influenza virus (H5 bird flu) occurred in Victoria, NSW and the ACT, affecting egg supplies. This, combined with the emergence of another extremely virulent strain which is spreading throughout the world has led to additional investment in preparedness activities. Significant animal diseases such as Foot and Mouth disease and Lumpy Skin Disease continue to occur in Indonesia and other near neighbours, with the Australian Government working with industry and the Indonesian Government to develop and strengthen prevention and preparedness measures (ABARES 2024c).
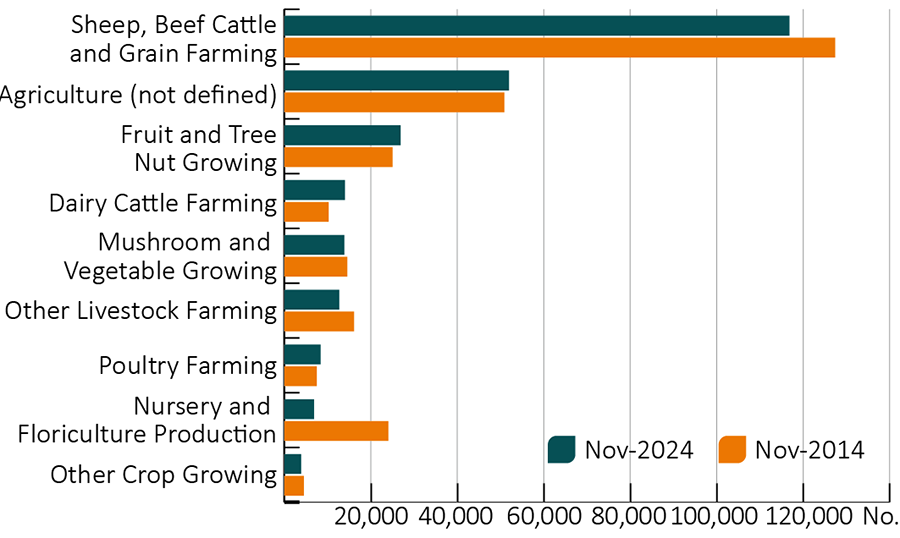
Labour is a key input to Australian agriculture. According to the latest Australian Bureau of Statistics (ABS) Labour Force Survey (ABS 2024e), the Australian agricultural sector employed 274,900 people on average over the four quarters to November 2024, up 6.7% from the previous year but down 1.8% from a decade earlier. Sheep, beef cattle and grain farming is the largest employer by industry, followed by fruit and tree nut growing, and nursery and floriculture production (Figure 8).
Figure 8 Employment by agricultural industry, November 2014 and November 2024
The more complete scope of the ABS Labour Account, which includes employed short-term non-residents and counts secondary jobs, reveals a higher estimate of 368,000 employed people in agriculture on average over the four quarters to September 2024 (ABS 2024f). Even so, official statistics do not easily capture seasonal workers, labour hire workers and the agricultural workforce that extends beyond the farm gate, meaning that there are limitations in how completely and accurately the workforce can be counted (Capel 2024).
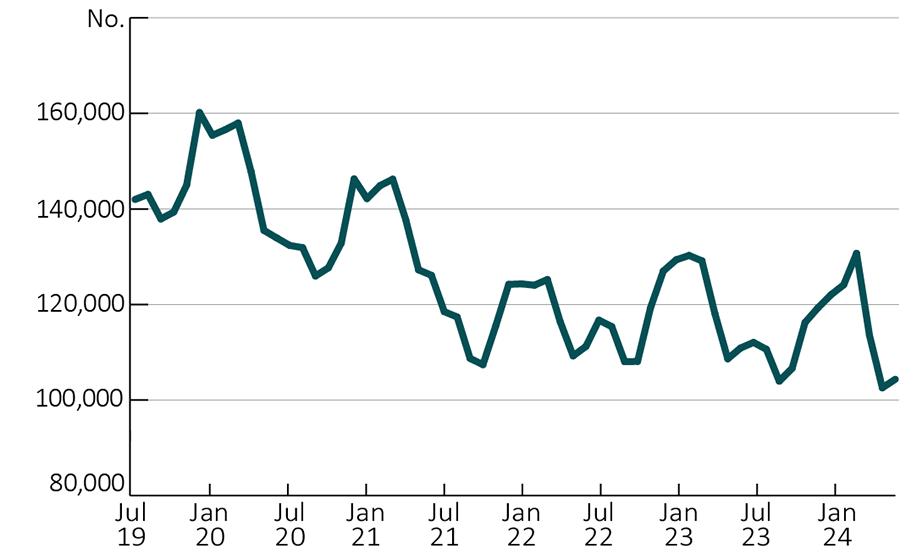
Variation in total employment on farms throughout the year occurs almost entirely through changes in the use of casual and contract labour. The number of casual and contract workers employed on farms peaks in late summer and is at its lowest in late winter, reflecting the timing of labour-intensive operations, such as planting and harvest. Horticultural farms tend to use relatively large amounts of casual and contract labour at key times of the year (Figure 9), while broadacre and dairy farms tend to use this kind of labour to a lesser extent and more consistently through the year.
Figure 9 Horticulture farm labour use, July 2019 to June 2024
Average farm cash incomes for broadacre and dairy farms over the 3 years to 2023–24 were well above the averages for the previous 10 years, although there were differences across the industries. This reflects the record incomes recorded in most industries in 2021–22 following good seasonal conditions and high commodity prices, even though incomes are estimated to have since fallen sharply since (ABARES 2024a).
For cropping farms, the 3-year average of average farm cash income to 2023–24 was around 55% higher than the average for the previous 10 years in real terms. Despite fluctuations from year to year, total cash receipts for cropping farms increased at a faster rate than increases in total cash costs over the longer term, reflecting improvements in farm productivity (Ashton, Welsford-Brink & Ryder, 2024).
Dairy farms have performed strongly in recent years, with the 3-year average to 2023–24 being around 130% higher than the average for the previous 10 years. The strong recent performance of dairy farms was a result of record high milk prices in 2022–23 and reduced expenditure on key inputs like energy, fertiliser, chemicals and fodder (Topp, Ryder & Ashton, 2024).
Incomes for livestock farms have been mixed in recent years. Despite sharp falls in incomes estimated in 2023–24, average incomes for specialist beef farms in the 3 years to 2023–24 were around 15% higher than the average for the previous 10 years. This reflects small improvements in farm productivity and increases in total cash receipts outweighing increases in total cash costs (Ashton, Welsford-Brink & Ryder, 2024).
Incomes for specialist sheep farms fell in recent years. Average farm cash income for the 3 years to 2023–24 is estimated to have been around 50% lower than the average for the previous 10 years. This reflects modest growth in productivity and a declining trend in incomes since incomes peaked in 2017-18 as a consequence of rising farm costs and changes in wool, lamb and mutton prices, as well dry seasonal conditions in some years (Ashton, D, Welsford-Brink, Q and Ryder, J, 2024).
Figure 10 Average farm cash income per farm, by industry, Australia
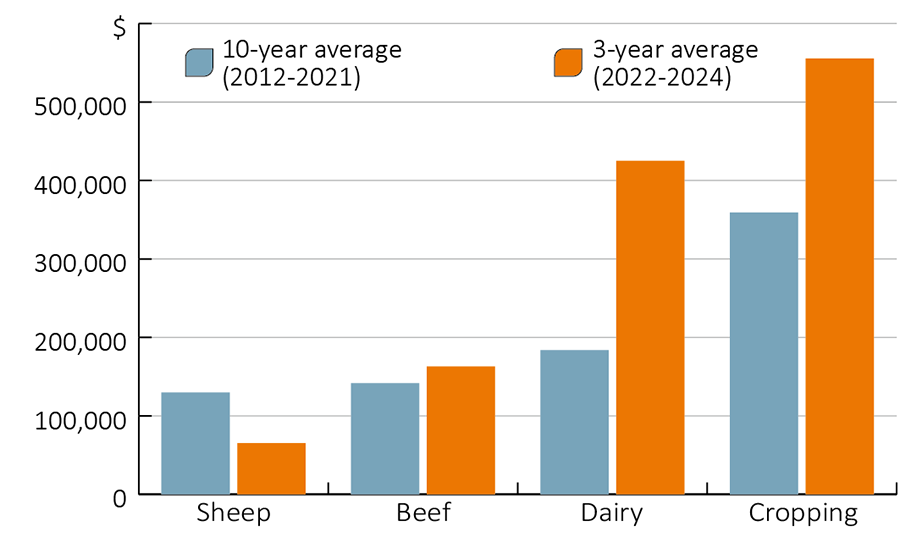
Source: ABARES Australian Agricultural and Grazing Industries Survey and Australian Dairy Industry Survey
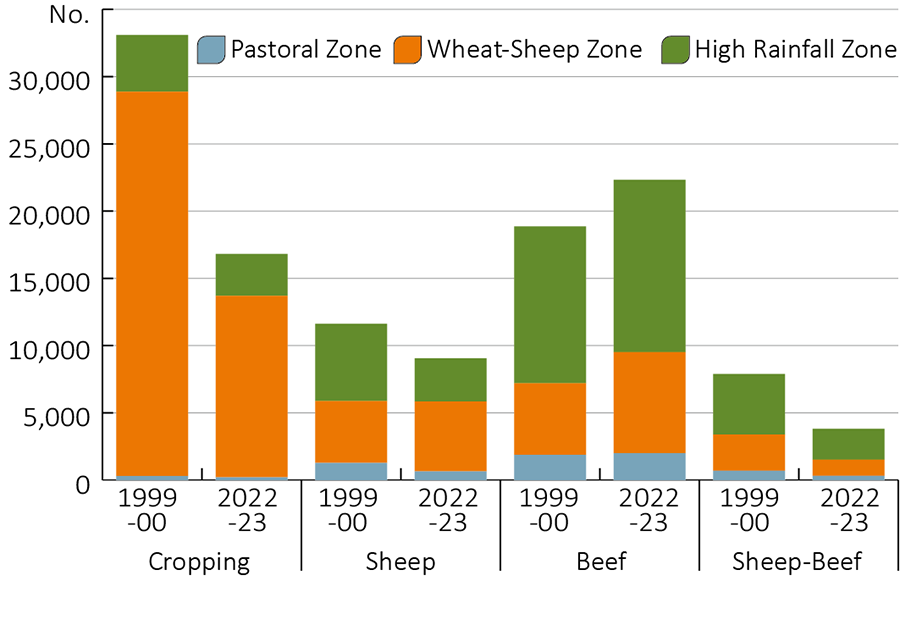
At June 2022, there were 87,800 agricultural businesses with an Estimated Value of Agricultural Operations (EVAO) of $40,000 or greater in Australia (ABS 2021-22). Broadacre and dairy farms accounted for an estimated 56,500 farm businesses in 2022–23, with 62% classified as livestock farms, 30% cropping farms and 8% dairy farms (Ashton, Welsford-Brink & Ryder, 2024).
Between 1999–2000 and 2022–23 the number of broadacre and dairy farms declined by an estimated 33%. The largest proportional decline in the number of farms was in the wheat-sheep zone where considerable amalgamation of farms into larger enterprises has taken place. Many of these farms have shifted toward more specialised cropping enterprises producing a broad range of cereals, oilseeds and coarse grains.
The exception is specialist beef farms which increased in total number between 1999–2000 and 2022–23. The number of specialist beef farms increased in all zones, mainly as a result of a shift away from wool production and dairy farming.
The number of specialist sheep farms increased slightly in the wheat-sheep zone but have fell in the high rainfall and pastoral zones.
Figure 11 Number of broadacre farms by zone, Australia, 1999–00 and 2022–23
Over the longer term, farm incomes have been adversely affected by trends toward higher temperatures and lower winter rainfall. ABARES modelling (Hughes et al. 2022b) estimated that changes in seasonal conditions over the period 2001 to 2020 (relative to 1950 to 2000) reduced annual average broadacre farm profits by 23%, or around $29,200 per farm (Hughes & Gooday, 2021). These impacts have been most pronounced in south-western and south-eastern Australia, with northern Australia and the coastal higher rainfall zones tending to be less affected (Figure 12).
The effects of climate variability on farms are complex and can vary greatly across locations, farm types and sizes. On average, cropping farms face greater climate risk than livestock farms, whereas the risk associated with price variability is larger for livestock farms than cropping (Figure 13). In drought years, cropping farms are subject to large declines in production and revenue due to reduced crop yields, while livestock farms can partially offset drought impacts in the short-term by increasing livestock sales (i.e. de-stocking, see Hughes et al. 2019).
Figure 12 Changes in seasonal conditions over the past 20 years have reduced average annual broadacre farm profitability

Source: Hughes, N, Lu, M, Soh, W Y, & Lawson K 2022a, Modelling the effects of climate change on the profitability of Australian farms, Climatic Change, vol. 172
Figure 13 Change in annual broadacre farm profitability due to climate and price risks
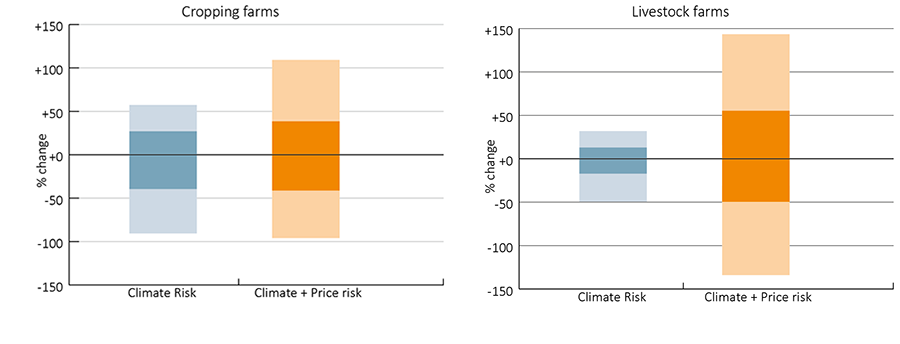
^Change in profit is presented relative to the median year.
*Change in profitability given historical climate conditions, commodity prices held constant (isolated impact of climate on profitability). For more information see Hughes et al.
Source: ABARES farmpredict
Australian farmers have a number of strategies for managing risks associated with short term fluctuations in climate, including maintaining relatively high levels of equity, liquid assets and borrowing capacity, using inputs conservatively, diversifying across enterprises and locations and earning off-farm income.
Exposure to climate variability and drought risk varies across Australia but is generally higher in drier in-land agricultural zones compared with high-rainfall coastal zones (Hughes et al. 2022a). Price variability can be managed by cropping farms better than livestock farms due to cropping farms having typically more diverse production and greater options for centralised marketing and storage.
Productivity is a core economic statistic that measures how well inputs such as labour, land, capital, materials and services have been used to generate outputs such as wheat, livestock and wool. It is an important measure of the competitiveness of Australian agricultural industries and a determinant of economic wellbeing. Productivity can change over time in response to factors that affect the outputs produced or inputs used.
Australian farmers have benefited from a long period of sustained productivity growth over the last five decades. However, since 2000-01, this growth has slowed compared to the productivity gains achieved during the 1980s and 1990s—when structural adjustment and the adoption of labour-saving mechanisation was in full force (Chancellor and Boult 2024).
Figure 14 Growth in broadacre farm productivity has slowed over time
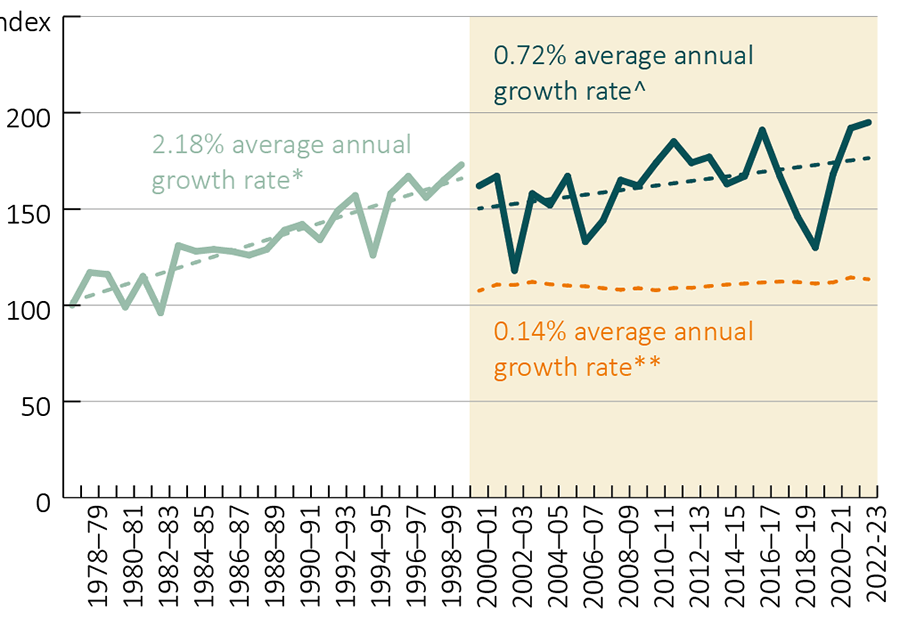
*All broadacre farms from 1977–78 to 1999–00.
^All broadacre farms 2000–01 to 2022–23.
**Market sector.
Source: Chancellor and Boult (2024)
Throughout the 1980s and 1990s, broadacre farm productivity grew at an annual rate of 2.18% — spurred on by significant policy reform, farm consolidation, the establishment of the Rural Research and Development Corporations (RDCs) and the uptake of machinery and new technology (Figure 14). As subsidies and other support mechanisms were removed, low productivity farms could no longer compete, and many exited the industry. The sale of these farms freed up land resources, facilitating the expansion of more productive farms allowing them to fully benefit from increased scale. As farms became larger, new technologies and machinery were widely adopted, meaning that farms could generate large quantities of output (e.g. tonnes of wheat) using proportionally fewer inputs (e.g. labour). Precision technology facilitated productivity growth further, enabling highly efficient use of chemicals, fertiliser, seed and other intermediary inputs with minimal waste.
In the more recent period from 2000-01 to 2022-23, Australian broadacre farm productivity growth has slowed and became increasingly volatile. The average annual growth rate over this period was 0.72%. Despite this slowdown, the average annual growth rate for broadacre productivity exceeded that of the market sector (Figure 14).
Productivity thrives in free and open markets, where structural change is unobstructed, and market failures are corrected. It also benefits from investment in agricultural R&D which allows for the adoption of new farming methods and technologies. Total Australian agricultural R&D funding in 2023-24 was $2.98 billion, increasing slightly from $2.91 billion in 2022-23 (ABARES 2024e). Continuously fine-tuning policy measures to promote competitiveness and continuing to invest strongly in research and development will likely assist in supporting productivity growth.
Globally, agriculture has a large environmental footprint. The sector accounts for around 50% of global land use, 73% of global deforestation, 70% of global water use and 34% of global greenhouse gas emissions (OECD 2023).
Governments, investors and consumers are responding to this by increasing demand for sustainability credentials in global food systems (KPMG 2022; WEF 2023). For example, the European Union (EU) has implemented the transitional phase of a carbon border adjustment mechanism applied to emissions-intensive imports (currently excluding agricultural products). Some governments are also considering mandatory adoption of reporting standards for business, relating to climate risk and other sustainability criteria (CCA 2022; WEF 2023). In Australia, mandatory climate reporting began to be phased in from 1 January 2025, starting with large businesses and financial institutions and expanding to more businesses over time.
Australia’s major agricultural industries have anticipated these trends and developed sustainability frameworks, including annual updates from the Australian Beef Sustainability Framework and the ongoing development of the Australian Agriculture Sustainability Framework. Going forward, there is concern about the development of fragmented reporting landscapes and inconsistent sustainability criteria across markets, which has the potential to restrict trade and market access if unresolved (WEF 2023).
Australian agriculture has strong sustainability credentials. The sector’s chemical and fertiliser use is at world best practice levels. For example, Australia’s application of nitrogen fertiliser is 90% lower than the Netherlands, 81% lower than France and 74% lower than the United States per hectare of arable and permanent cropland (OECD 2024a).
Australia also has remarkably low on-farm emissions per unit of agricultural output. A representative basket of major agricultural commodities produced in Australia produces 42% less emissions than in the United States, 29% less than the EU and 12% less than New Zealand (Figure 15) (ABARES 2024f).
Figure 15 Indicative agricultural emissions of a basket of major agricultural commodities (3-year average, 2018–2020)
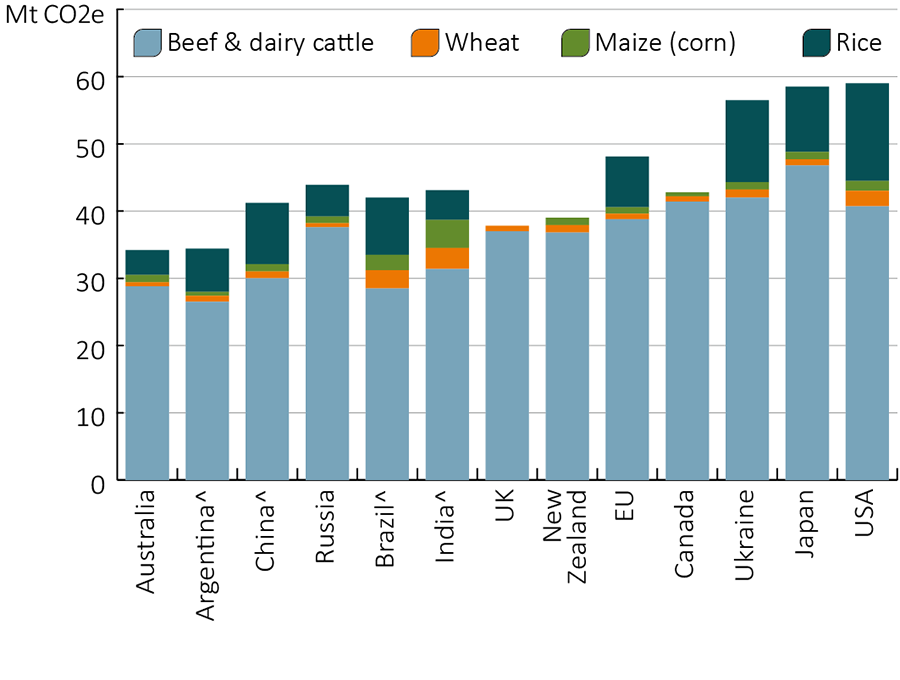
^Calculated according to 2019 revision of IPCC guidelines.
*Rice data unavailable for Canada, New Zealand and United Kingdom. Maize data unavailable for United Kingdom.
Source: DCCEEW 2024a Sources of Australia's agricultural emissions
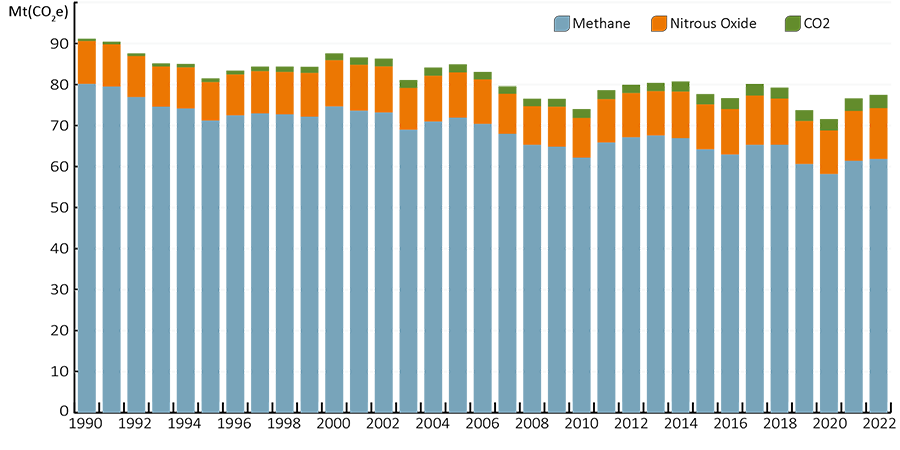
Australia’s farm sector emissions fluctuate each year, based on seasonal conditions. Between 2005 and 2022, agriculture contributed between 12% and 18% of national greenhouse gas emissions (DCCEEW 2024a). Almost 80% of Australia’s agricultural emissions are methane, deriving mainly from cattle and sheep industries. Despite annual fluctuations, Australia’s aggregate agricultural emissions have fallen over time, largely reflecting a shift in commodity mix, from sheep to cropping (Figure 16).
Figure 16 Australian agricultural emissions by gas, 1990–2022
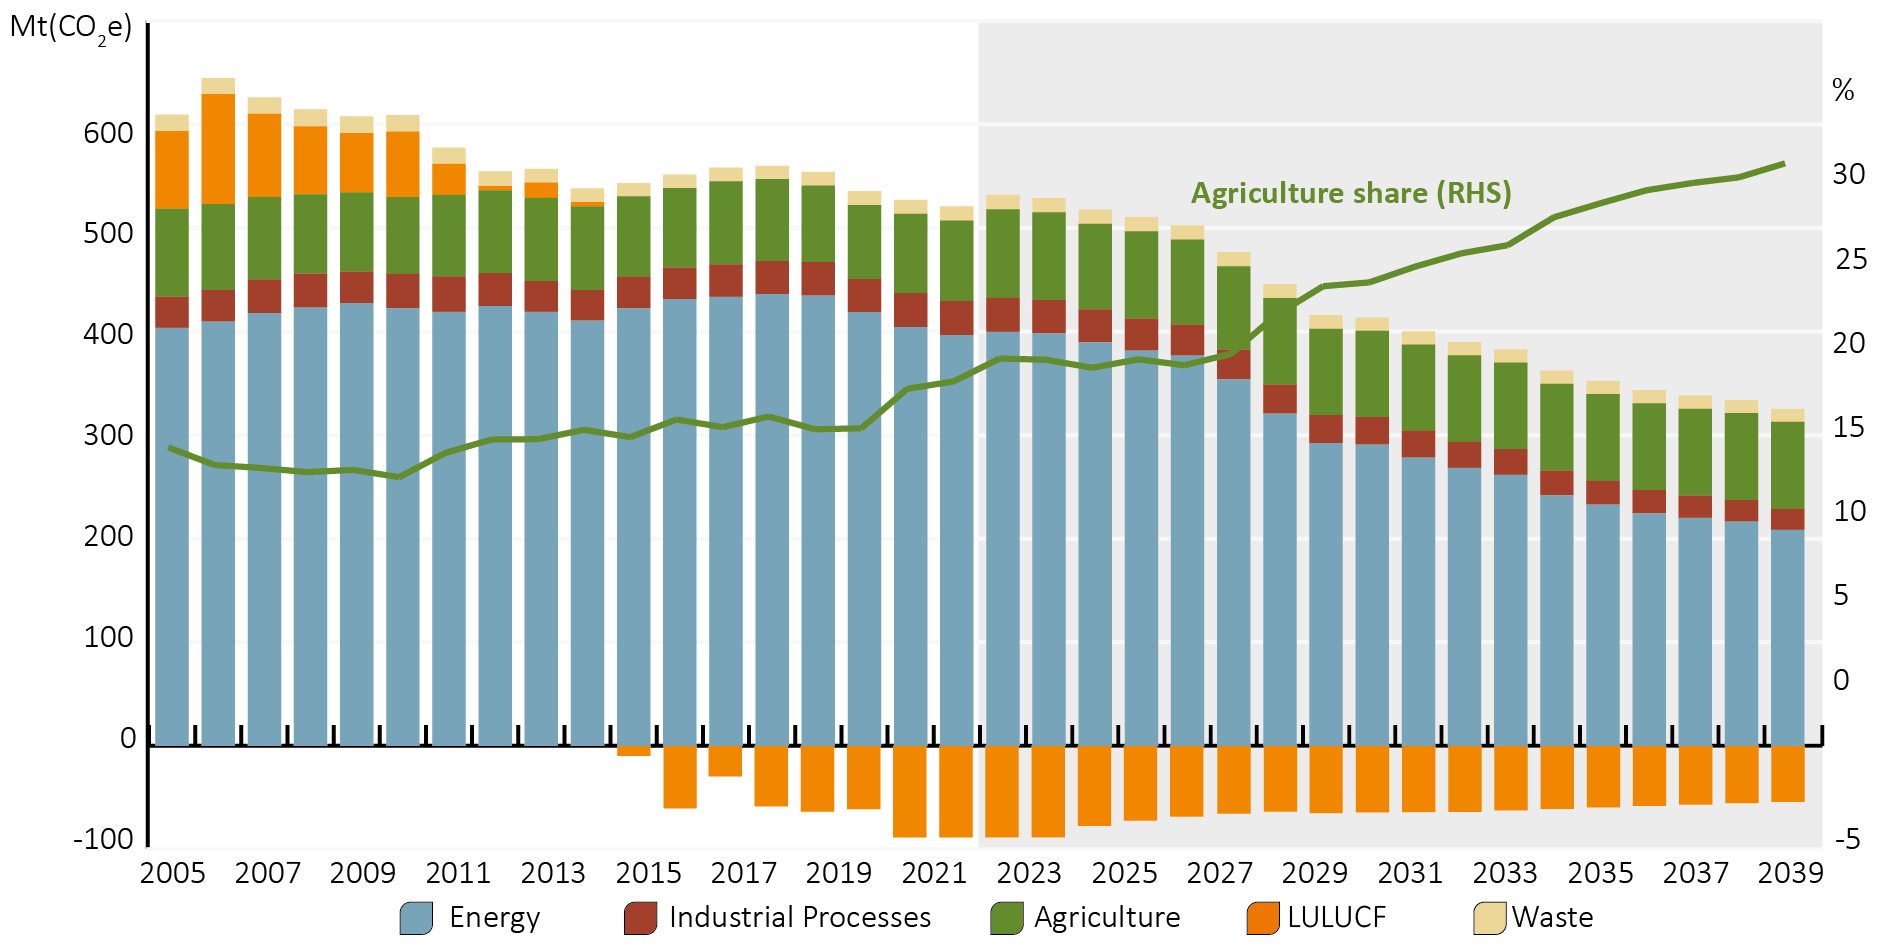
Australian agricultural emissions are expected to slowly decline over the next 15 years, from 86 million tons in 2023 to around 84 million tons in 2040 (Figure 17). However, as the rest of the Australian economy decarbonises, agriculture's share of emissions is expected to increase from a projected 19% in 2023 to over 30% in 2040 (DCCEEW 2024b). While it is recognised that the complexity and diversity of agricultural systems, within Australia and globally, makes the development and implementation of abatement technologies more challenging for agriculture (IPCC 2022; McKinsey & Company 2020), over time this rising share of national emissions will increase pressure on the sector to change production systems and invest to reduce emissions.
Figure 17 Annual Australian emissions and DCCEEW baseline projections, 2005–2040
While low-cost measures to reduce emissions exist, such as herd management and planting trees on farms (AgriFutures 2022), substantial reductions in agricultural emissions will require the development of products to reduce methane production from ruminant livestock (Black et al. 2021). Some technologies are currently being trialled in several countries, including Australia. However, cost remains an obstacle to widespread adoption, and future pathways for agriculture must recognise global food security, least cost approaches to decarbonisation and the need to enhance productivity and efficiency in global agri-food markets.
Removing existing agricultural support policies, which distort global agricultural markets and impede productivity growth in the sector, is one practical way to improve sustainability outcomes. Currently around $630 billion a year is transferred globally in trade and production distorting agricultural support such as subsidies and tariffs (OECD 2024b). Removing this support can reduce the greenhouse gas emissions associated with food production by shifting production into more efficient products and countries, thereby contributing to improved agricultural productivity and less food waste (Fell et al. 2022; Cao et al. 2023). Doing so will also improve global food security, household welfare and economic growth. Australia is already doing its part, with very low levels of support to farmers. But ongoing effort in multilateral frameworks is required to achieve global benefits.
Figure 18 Impact of removing subsidies and trade barriers
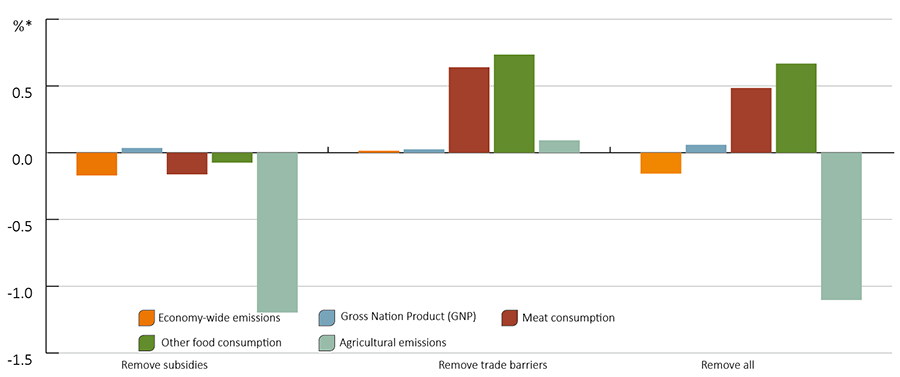
Source: Cao et al 2023
ABARES 2024a, Agricultural Commodities: December quarter 2024, Australian Bureau of Agricultural and Resource Economics and Sciences, Canberra, DOI: https://doi.org/10.25814/82b5-tg66.
ABARES 2024b, Catchment Scale Land Use of Australia – Update December 2023 version 2, Australian Bureau of Agricultural and Resource Economics and Sciences, Canberra, DOI: https://doi.org/10.25814/2w2p-ph98.
ABARES 2024c, Agricultural Commodities: June quarter 2024, Australian Bureau of Agricultural and Resource Economics and Sciences, Canberra, DOI: https://doi.org/10.25814/g0cz-s307.
ABARES 2024d, Agricultural Commodities: September quarter 2024, Australian Bureau of Agricultural and Resource Economics and Sciences, Canberra, DOI: https://doi.org/10.25814/ffgs-mx60.
ABARES 2024e, Agricultural research and development (R&D) investment in Australia – 2023-24 update, viewed on 23/01/2025 from https://www.agriculture.gov.au/abares/research-topics/productivity/agricultural-research-and-development-investment-in-australia.
ABARES 2024f, International farm emission intensity statistics, Australian Bureau of Agricultural and Resource Economics and Sciences, Canberra.
ABARES forthcoming, Labour use in Australian agriculture: Analysis of survey results, 2023–24, Australian Bureau of Agricultural and Resource Economics and Sciences, Canberra.
ABS 2021-22. Agricultural Commodities, Australia, Australia, Australian Bureau of Statistics, Canberra. https://www.abs.gov.au/statistics/industry/agriculture/agricultural-commodities-australia/2021-22.
ABS 2023a, Value of Agricultural Commodities Produced, Australia, Australia, Australian Bureau of Statistics, Canberra.
ABS 2023b, Water Account, Australia, Australian Bureau of Statistics, Canberra.
ABS 2024a, Australian Agriculture: Livestock, Australia, Australian Bureau of Statistics, Canberra.
ABS 2024b, Australian National Accounts: National Income, Expenditure and Product, Australia, Australian Bureau of Statistics, Canberra.
ABS 2024c, Balance of Payments and International Investment Position, Australia, Australia, Australian Bureau of Statistics, Canberra.
ABS 2024d, Labour Force, Australia, Detailed, Australia, Australian Bureau of Statistics, Canberra.
ABS 2024e, Labour Force, Australia, Detailed, Australia, Australian Bureau of Statistics, Canberra, accessed 8 January 2025.
ABS 2024f, Labour Account Australia, Australian Bureau of Statistics, Canberra, accessed 8 January 2025.
ABS 2025, International Trade in Goods, Australia, Australian Bureau of Statistics, Canberra.
AgriFutures 2022, A farmer’s handbook to on-farm carbon management, Publication no. 22-054.
Ashton, D, Welsford-Brink, Q and Ryder, J 2024a, Financial performance of cropping farms: 2021–22 to 2023–24, ABARES, Canberra, July, DOI: https://doi.org/10.25814/baj6-dr22. CC BY 4.0.
Black, JL, Davison, TM & Box, I 2021, Methane Emissions from Ruminants in Australia: Mitigation Potential and Applicability of Mitigation Strategies, Animals, vol. 4, no. 1, DOI: https://doi.org/10.3390/ani11040951.
Cameron, A 2017, ‘Share of agricultural production exported’, in Agricultural commodities: ABARES 2017, Agricultural commodities: December quarter 2017.
Cao, LY, Burns, K & Greenville, J 2023, Reforming agricultural markets to support emissions reductions, Australian Bureau of Agricultural and Resource Economics and Sciences, Canberra, DOI: https://doi.org/10.25814/zjg3-0b14.
Capel, L 2024, Defining the agricultural workforce, ABARES research report, Australian Bureau of Agricultural and Resource Economics and Sciences, Canberra, February, DOI: https://doi.org/10.25814/rf44-kp75.
CCA 2022, First Annual Progress Report: the baseline, global context and methodology, Climate Change Authority, Canberra.
Chancellor, W. & Boult, C. 2024, Australia’s farm productivity slowdown – why it matters, and what it means for policy makers, ABARES Insights, Canberra, July. CC BY 4.0 DOI: https://doi.org/10.25814/dcvj-7934.
Coelli, R 2021, Natural Resource Management and Drought Resilience – survey of farm practices, ABARES research report 21.12, Canberra, DOI: https://doi.org/10.25814/99n0-7q92.
DCCEEW 2024a, Australia's National Greenhouse Accounts, Department of Climate Change, Energy, the Environment and Water, Canberra.
DCCEEW 2024b, Australia’s emissions projections 2023, Department of Climate Change, Energy, the Environment and Water, Canberra.
Dodd, A., Stoeckl, N., Baumgartner, J., & Kompas, T. (2020). Key result summary: Valuing Australia’s biosecurity system. Centre of Excellence for Biosecurity Risk Analysis (CEBRA) Report. https://cebra.unimelb.edu.au/__data/assets/pdf_file/0020/3535013/CEBRA_Value_Docs_KeyResultSummary_v0.6_Endorsed.pdf
Fell, J, Liangyue, C, Burns, K & Greenville, J 2022, Emissions, agricultural support and food security, ABARES Insights, Issue 6, Canberra, https://doi.org/10.25814/r6ep-9f06.
Greenville, J and Cameron, A 2022 ABARES Insights: Where to next for Australian agriculture? ABARES Insights, Canberra, DOI: https://doi.org/10.25814/vb1b-xr37.
Hughes, N, Galeano, D & Hattfield-Dodds, S (2019), The effects of drought and climate variability on Australian farms, ABARES, Canberra, DOI: http://doi.org/10.25814/5de84714f6e08.
Hughes, N & Gooday, P 2021, Climate change impacts and adaptation on Australian farms, ABARES Insights, Canberra, DOI: http://doi.org/10.25814/589v-7662.
Hughes, N, Lu, M, Soh, W Y, & Lawson K 2022a, Modelling the effects of climate change on the profitability of Australian farms, Climatic Change, vol. 172, DOI: https://doi.org/10.1007/s10584-022-03356-5.
Hughes, N, Soh, W Y, Lawson, K, & Lu, M 2022b, Improving the performance of micro-simulation models with machine learning: The case of Australian farms, Economic Modelling, Volume 115, DOI: https://doi.org/10.1016/j.econmod.2022.105957.
IPCC 2022, IPCC Sixth Assessment Report, Intergovernmental Panel on Climate Change.
KPMG, 2022, The time is now: The Australian Agricultural Sustainability Framework (AASF) and its role in sustainable supply chains.
McKinsey & Company 2020, Agriculture and climate change: Reducing emissions through improved farming practices.
OECD 2023, Agricultural Policy Monitoring and Evaluation 2023, Organisation for Economic Co-operation and Development.
OECD 2024a, Agri-Environmental Indicators Database 2024, Organisation for Economic Cooperation and Development.
OECD 2024b, Agricultural Policy Monitoring and Evaluation 2024, Organisation for Economic Co-operation and Development.
Topp, V, Ryder, J and Ashton, D 2024, Financial performance of dairy farms: 2021–22 to 2023–24, ABARES, Canberra, October, DOI: https://doi.org/10.25814/a8tw-g681 CC BY 4.0.
WEF 2023, Emissions Measurement in Supply Chains: Business Realities and Challenges, World Economic Forum.
ABARES Insights: Snapshot of Australian Agriculture 2018
ABARES Insights: Snapshot of Australian Agriculture 2020
ABARES Insights: Snapshot of Australian Agriculture 2021
ABARES Insights: Snapshot of Australian Agriculture 2022
ABARES Insights: Snapshot of Australian Agriculture 2023
ABARES Insights: Snapshot of Australian Agriculture 2024
If you have difficulty accessing these files, please email ABARES for assistance.